🛶 Introduction
I will document my journey into the SRE world here, you will find notes from books I am reading, as well as other stuff I find relevant throughout the journey.
Becoming SRE
⚠️ These are notes taken from the book Becoming SRE by David N. Blank-Edelman O'Reilly. It is an splendid book and no amount of notes I take will make it justice, please go read it and just use this as a reference.
Table of Contents
- Introduction to SRE
- Becoming SRE for the Individual
Introduction to SRE
First things first
Site Reliability Engineering is an engineering discipline devoted to helpings orgs sustainably achieve the appropriate level of reliability in their systems, services and products.
3 key words from definition
- Reliability: even if you have the best software in the world, and the best
sales team, if the sw is not up when customers need it, you lose a lot of:
- Revenue
- Time
- Reputation
- Health
- Hiring
- Appropriate
- Usually 100% reliable is not achievable, it is likely that your dependencies are not 100% reliable.
- You need to use service level indicators/service level objectives (SLI/SLO) to help determine an appropriate level of reliability.
- Sustainable
- If the people in the org are burned out they wont be able to build reliable systems.
SRE vs Devops
-
SRE implements class devops
-
SRE is to reliability as devops is to delivery
-
It’s all about the direction
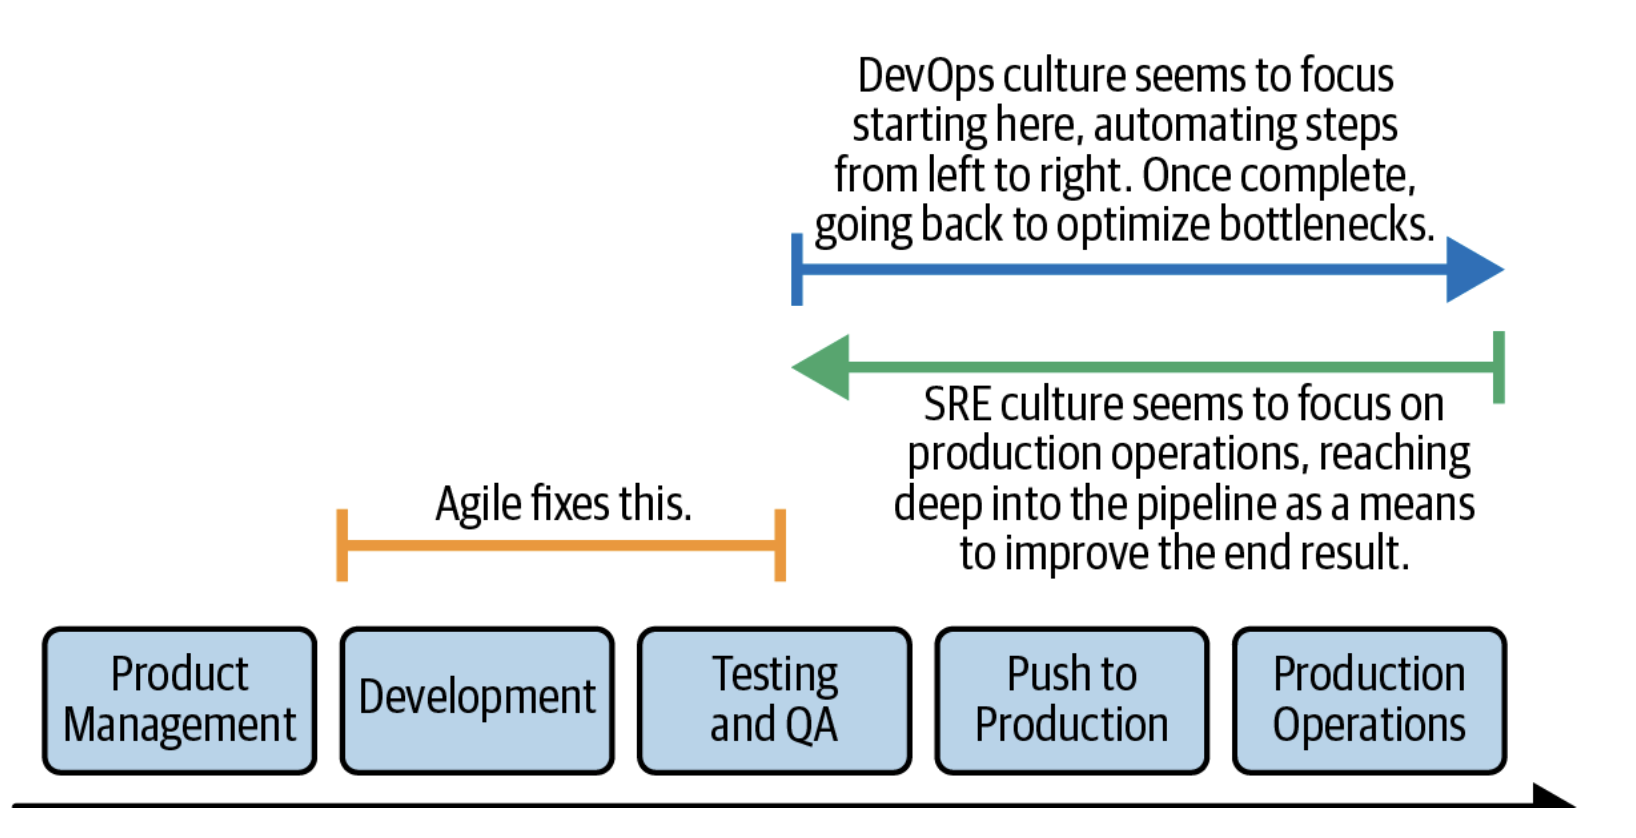
- Devops go from development to production operations
- SRE seems to start on prod operations, and going back to improve the result.
Basically these two phrases:
- Devops thinks, how can I deploy this from my laptop to production
- SRE starts at production, how can I make the environment more reliable.
SRE Mindset
It is born out of curiosity: How does a system work? How does it fail?
Zoom out and Zoom in as much as possible, how does the… work
- The whole app, development and deployment process
- The entire service
- The infrastructure
- The physical overlay of the infra
- The sociotechnical context in which the infra runs
- The org context where the sociotechnical context resides in
Keeping Focus on the Customer
Small example, say you have a 100 servers running a front end pool, suddenly 14 systems fail and are not recovering. This situation is:
- No big deal; you can deal with it at your leisure
- Something that warrants your immediate attentions. Stop what you are doing and focus on this
- Crisis, even if 2 AM go wake the CEO
The answer, it depends, you need to ask, how does this affect the system as a whole. If the customers wont see anything diff then a. If visible by customers then b. If the service is dead in the water and this means no revenue, go wake the CEO.
So basically you need to ask: What is the intention of the system from the customer’s perspective?
SRE’s Relationship with Failure
SRE are very collaborative. Reliability is a collaborative endeavour by nature.
The SRE mindset views errors as an opportunity to learn. Learning from failure is a core component of an SRE.
SRE treats errors as a signal and we like clear signals. With an SRE mindset errors can serve the helping understand the system better. This means we need to surface the errors in addition to eliminate them.
SRE feels ownership of the whole service, they do not say often “not my code, not my problem”. This can be un arma de doble filo. Because of the yak shaving issue, where you go to do one task, say update a package, but then you check and for the new package you need to upgrade the OS, but to upgrade the OS you need to… and you end up with a trimmer in your hands and a yak infront of you. Taking ownership of the whole range of services and so on, can lead to this. **
The Mindset in Motion
- How does a system work? → How will the system work if we scale it?
- How does a system work? → How can the system work with less operational load
- SREs are angered by toil and the almost allergic reaction it provokes in them.
- How does a system work? → How can the system work reliable for more people
Culture
Support an enviorment where SREs can thrive.
- Celebrate the elimination of toil, give SREs opportunity to look for toil and come up with ideas on how to remove it.
- Support curosity
Other good way is to support the creation of documentation “it is not finished until it is documented”
New hires
For new hires good some good tasks are:
- Find something unclear, missing or in some way needing improvment on the docs
and fix it.
- This has the benefit that they need to interact with the docs and read it, at a deep enough level that they can improve it.
- Taking our inline database of all systems on our network, and make sure it was correct by visiting the locations
Avoid
How to avoid the incident-handling train of the SRE will always fix everything.
A good question to anwser is “Who is getting smarter and what are we doing about it?” The ideal would be that you are getting good new info about your systems and how they fail.
But if just the SREs are the ones that are learning, you are in reverse, you are going the opposite direction of culture you are hoping to create.
If the answer is close to: SREs, engineering personnel and relevant stake holders, you can go to the next question, What is the rest of the org doing with this knowledge?.
Cool Ideas to improve culture
- Start a postmortem group,
- Where someone does a writeup of an issue/outage that happened. Give it in
advance before the meeting, and discuss what could have been done diff,
or proposal on the arch, stuff like that.
- Good first questions are:
- What is missing from the write-up we have here?
- What do we still not know, or what may we never know?
- Why wasn’t this worse?
- Good first questions are:
- Where someone does a writeup of an issue/outage that happened. Give it in
advance before the meeting, and discuss what could have been done diff,
or proposal on the arch, stuff like that.
SRE Advocacy
There are two times where SRE Advocacy is most imporant
- early stages: you need to be able to tell people why they need an SRE
- expansion phase: “Cool, you’ve been able to set up a new SRE group. Now you have to get others to play with you. How do are you going to do that?”
Humans are weird to be story-receiving machines. Let’s go back to the definition
Site reliability engineering is the discipline devoted to helping orgs sustainably achieve an appropriate level of reliability in their systems, services and products.
You can tell stories about…
- Efficacy
- Partner suffering with reliability issues, SRE got involved and helped with X, Y and Z and now they are in a better place.
- Reputation
- How famous company X adopted SRE
- Possibility
- How comparable company X adopted SRE, how it went, issues, how they overcame. If they can you can do it to
- Surprise
- Story about an outage and the surprising result or finding uncovered by SRE postmortem process
- Transformation
- how things use to be, but now we are in a better place
- Puzzle
- X was a situations that made no sense; here’s how we solved the mystery step by step
Keep notes on things that happen, the brain is bad at memory stuff.
Add cliffhangers to your stories, “all pointed to human error, but something did not feel right..”
“Here is how I failed and leveled up based on that experience”
Becoming SRE for the Individual
Preparing to be an SRE
This is not like super mandatory, but will help you a lot with being an SRE:
Do I need to know how to code? Yes
- If you do not know how something is built your ability to understand it decreases
- Learning how to code will teach you how to debug/troubleshoot
- Many tools come in data formats that developers use in their day to day (JSON, YAML)
Fundamentals
Is always good to know about the Big O notation, this will let know people you know about data structures and efficiency.
- Single/Basic Systems
- You need to know how an OS works, about networking, permissions, protocols and how they fail.
- Distributed Systems
- Almost everything now is a distributed system
- Statistics and Data Visualization
- You need to understand and talk easily about, percentiles, standard statistical operations, aggregate and compound.
- The ability to improve reliability in most situations is predicated on how to have conversations about data
- Storytelling
- Post incidents reviews and post-mortems are literally tell a story
- Be a good person
Other nice to have
- Non-Abstract Large System Design (NALSD)
- Process of designing and reasoning about large systems
- Check highscalabilty.com and chapter 12 of The Site Reliability Workbook oreilly book/)
- Resilience Engineering
- Chaos Engineering and Performance Engineering
- Machine Learning and Artificial Intelligence
Getting to SRE from….
From Dev/SWE
You need to shift your focus to these areas:
- How does your code really function when in production?
- How will it behave when the internet can throw any input at it.
- What happens if the connection to the DB is slower than in your dev env.
- Failure nodes
- Do you have a good sense on how your code fails?
- How can you tell when it is about to fail?
- What have you built into the code to make figuring out whether your code is running well easy or possible?
- How easy have you made handle upgrades?
- and rollbacks?
- Have you written good docs on for an SRE audience?
Basically: How much do you think about running your systems in additions to building them?
From Sysadmin
Sysadmins live to serve, they bridge the gap between technology and the people that use it.
You already have a good well-exercised skill for troubleshooting and debugging.
Do exercises in SadServers, like leet code but for infrastructure.
Change you mindset from “monitor all the things” to “measure reliability from the customer perspective, not the component perspective”
Using terms like “contributing factors” instead of “root cause” can change both your internal and external way of looking at an issue. More on this on chapter 10.
Since you are already answering tickets, getting emails on things failing, you can start using that as a data set to start measure the reliability of the systems and how/why they fail.
More advice
Do not forget to track your progress, so you have something to look at when they reject you from an interview, or when you feel indifference to your ideas.
Hints for Getting Hired as an SRE
Some general advice of getting hired as an SRE
Looking closely at the job posting
Few thing to check:
- The tech mentioned
- Modernity of the tech
- How items hand together
- k8s/prometheus makes sense, k8s/nagios does not
- Mention of Ticketing System
- How quickly will things move in that env if its ticket based.
- Specific versions of sw
- they need a very specific thing
- Mix of on-premise and cloud products
- Are they all in the same env?
- Mention of programming languages
- Coding has meaning to them
- Heavily skewed toward CI/CD and env provisioning tools
- May have been a devops position, which is a diff mindset
- Presence or absence of a monitoring tech
- What connection if any would monitoring have to this role?
- Services that are consumed
- What am i getting into from dependencies perspective
- The human connection
- Look for an indication of the stakeholders or collaborators
Look for post-incidents reviews, they can be a helpful way of how they handle issues, what’s their SW stack and stuff like that. Do not bring that up in the interview unless they do.
Preparing for an SRE interview (Resources)
Depends (of course) of the posting, it could be more SWE focus, or CI/CD focus, but there are four things you need to study for the interviews:
-
NALSD (non-abstract large system design)
For systems that require scale (most of them)
Resources:
- The Site Reliability Workbook has a lovely chapter on the topic.
- There are a lot of talks on the topic USENIX
- Google has a public classroom for this https://sre.google/classroom/
-
Monitoring/observability
Good places to start:
- Practical Monitoring by Mike Julian (O’Reilly, 2017)
- Observability Engineering books by Charity Majors et al. (all from O’Reilly)
If you expect to talk about SLIs and SLOs review
- Implementing Service Level Objectives(O’Reilly, 2020).
-
Computing Fundamentals
- Computer science, computer networks, linux, distributed computing, stuff like that.
-
Troubleshooting and debugging
- Hopefully you have experience with this one, but sadservers.com is a good start
What to ask at the SRE Interview
Some good conversation starters:
-
Tell me about your monitoring system
This exposes all sort of info on organization, structure, collaboration, ownership, How decision are made, and so on.
Some follow up questions:
- Who owns monitoring in your org?
- How many monitoring systems are there in active use?
- Who (apps/services/teams) send data to those systems, and who access them?
- How easy it is to onboard a new app/service to your monitoring?
- What decisions are made using the data?
- Are there alerts generated fromt his system?
- What makes you happy and unhappy with your current system?
-
Tell me about your post-incidents review process
Here you are trying to see how intentional are they on learning from failure
- Do you hold post-incidents review after your outages?
- What is their purpose?
- Who is “in the room” for them?
- How do you document your outages?
- Can you tell me (at whatever level of details you are comfortable) about a recent outage
- Do you have a sense of the most common classes of outage you have seen in the last N month? (config related, overload/resource-deprivation failures, code bug)
-
Tell me about you on-call setup
- Do people get time off after incidents?
- Who in the org participates in an on-call rotation (just SREs? Devs? Managers?)
- When was the last time you personally were “paged”?
- Do people get paged equally often between work and off-work hours?
-
What problem does SRE exist to address in your org?
- If they cannot answer that: What are some ‘recent wins’ by SRE in the past 6 to 12 months?
-
Can SREs check in code to major repos in your org?
- You’ll see how involved is the SRE with dev work
A Day in the Life of an SRE
Because of the nature of the SRE role, it is hard to describe an average day, since it most days are different to each other. So instead of an average day, we have different modes SREs can relate to. Look at it like different hats an SRE will wear
-
Incident/Outage Mode
There will be days were most of your time you will be involved dealing with an accident. These days come with some feelings attached to them (fear, anxiety, and so on), the intensity of these feelings depend on the severity of the outage.
When on this mode you will be reacting not planning it is normal.
-
Post-incident Learning Mode
After the incident now you have the opportunity to review the memories of an outage and learn from it.
You are responsible for documenting it, in a way others can understand it. To do this you will have to investigate a bit, look for data in your monitoring systems, talk to your colleagues to discover what they knew and when.
-
Builder/Project/Learn Mode
This is when you actually have time to sit and...
- Devlop some code for services or SRE tasks
- Provision new envs or infra
- Improve monitoring/observability
- Removing toil
- Writing docs
- Learning a new tech in anticipation of using it some day
Of course, there will be times when you are doing boring stuff, but that can help you identify toil you need to remove.
-
Architecture Mode
Depends on your org, but, and SRE should be showing up to design and planning meetings where they are acting as a representative for reliability.
Be political about it, no one wants to hear, "this would have never happen if there was an SRE when this thing was designed". Appeal to the sense that everyone want to have their code in production be as reliable as possible.
-
Management Mode
If the response to, what did you do all day?, was, I went to meetings, do not worry, chances are you might be an SRE manager.
-
Planning Mode
Some portion of your day will be planning.
- Implementation plans
- Capacity planning
- Self-definitional work (goals of SRE team and stuff like that)
-
Collaboration Mode
The SRE role is relentlessly collaborative.
When you implement SLI/SLO (Service Level Indicators/Service Level Objectives) you will be working with: devs, PMs, stakeholders.
Another example of collaborative work, is what some people call pre-launch review. An SRE gets involved to revise the service being deployed in production, what is necessary for it to run reliably in production
Do not be a gatekeeper, share this work with the devs and the stakeholders, collaborate as much as possible
Finally, listen to the customers through monitoring work. The SLIs/SLOs (Service Level Indicators, Service Level Objectives) are meant to provide ongoing collaboration with the customer.
-
Recovery and Self-Care Mode
Burn out SREs are of no good to anyone. Because of the nature of SREs it can be easy to overextending yourself. But when we hear that someone is regularly working 60-75 hours, is not something to be proud of, that means there is a failure in the system and needs to be fixed.
You need to have recovery time.
-
On Balance
Balance is something good to strive for, but there are often situational factors that complicate the effort, for example, an early service vs mature service, new services are always noisier and require more reactive work. They also provide more toil to be stripped away, so maybe you expend more time in one of these modes than in others.
The idea is to see this as weather patterns, I know it is going to rain hard for some time, but I mentally prepare. Ideally things will level out. If not, you need to strive for it. SRE attempts to be a sustainable operations practice. If you realise this cannot be sustained maybe you need to start looking for a different job.
Establishing a Relationship to Toil
If a human operator needs to touch your system during normal operations, you have a bug. The definition of normal changes are your systems grow.
Carla Geisser, Google SRE
What is toil?
First of all we need to define toil. Toil is not the work you do not like to do or simply repetitive chores. Toil is the kind of work when running a production service, that to tends to be:
-
Manual Work like manually running a script that automates a task is still manual, the time that a human spends running the script is still toil time
-
Repetitive Toil is work you do over and over.
-
Automatable If human judgment is essential for the task, there is a good chance it is not toil.
-
Tactical Toil is reactive rather than strategy-driven.
-
Does not bring enduring value If your service is in the same state after you finished a task, the task was probably toil.
-
O(n) with service growth If the work involved scales linearly with the size of the service (traffic volume, service size) is it probably toil.
We need to have less toil because it tends to expand, if left unchecked it can quickly fill 100% of everyone's time, and people will stop doing Engineering Work. What is that? Engineering work is novel and requires human judgment. It produces permanent improvement in your service and is guided by strategy.
Now that we know what toil is, lets see the relationship SREs have to it.
Whose Toil Are We Talking About?
Whose toil is it? On opposed to other parts of SRE where we are customer focuses, here we need to focus on our toil, not the customers one. Sure, they might have a connection for example, operational toil (ours) is exposed to the customer if they have to go into 4 steps to make a request. But we need to keep the main focus on the operational toil.
Why do SREs Care about toil?
An argument can be made that if you remove toil a system becomes more reliable, but the author suggests that sometimes this is not the case. An that SREs because of their nature, are inclined to eliminate toil because of the following reasons.
-
Aesthetics SREs want to eliminate toil because if offends their aesthetic sensibilities. Toil is inelegant, inefficient, unnecessary, suboptimal, hard to look at. That simply is a reason to remove it.
-
Money Orgs have many reasons to want their expensive people do work that is significant that make the revenue forward, meaning the antithesis of toil.
-
Job Satisfaction
Early vs Established Toil
When an app is developed it is likely to have more toil than once it is established. Why? Developers care about making a solution to a customer problem, not making their app be super operational. They can be, and that is why it is important that an SRE is in the room when planning the Architecture for the app, but it is likely that it will have more toil than an established one.
It is important to note this, because now we can mentally prepare for it, we now know that there will be a finite period of work with a lot of toil, but it is expected and it will end.
Dealing with Toil
Usually people just say, automate it, and the toil will go away. But the author propose the idea that similar to matter that toil is not created and cannot be destroyed just transformed.
When you are automating a task, the toil did not disappeared it just got transformed into a different thing: Complexity. Usually this is a wise bargain to take, but it is important to keep in mind that it has its trade offs.
Intermediate to Advanced Toil Reduction
It is important to keep track of the toil we remove on individual systems, management will love to hear that X system required N manual steps and now it was automated and require N-4 steps. But once you pass that first stage you also need to start thinking. How can I reduce the toil we are going to have?
Go Remove the Toil
That is pretty much it for this chapter, we defined what toil is and how to deal with it. Go and put in practice what you have read here.
⛵️ k8s
Super surprised someone still writes the full Kuberenetes word instead of k8s. K8s looks way cooler
Specific k8s stuff
Things surrounding k8s
- ⎈ helm (it has a really good intro on k8s)
📜 ckad preparation
⚠️ these are notes taken from the ckad prep course by o'reily please go read it and just use this as reference.
Also if you only want to know what to focus on.
k8s in a nutshell
High level k8s arch
A k8s cluster has two kind of nodes
- control plane node: exposes the k8s API, so if you want to interact with the k8s cluster you need to go thru here.
- worker node: nodes that execute the workload. Needs to have a container runtime engine installed (containerd) for executing the containers.
Control Plane Node Components
- API server: expose k8s api
- Scheduler: Watches for new k8s pods and assign to nodes
- Controller Manager: watches the state of cluster, and makes changes
- etcd: a key-value that captures the state of the objects we create in the cluster
Common Node Components
Any node has these:
-
Kubelet: agent that makes sure the containers are running in a k8s pod, usually this one runs in the workers.
-
kube proxy: maintain network rules and allow communication
-
Container runtime: software responsible for running containers
Object Management
Hybrid approach for managing objects.
First you create the yaml automatically with the run command
k run nginx --image=nginx --dry-run=client -o yaml > nginx-pod.yaml
Then you can edit it with vi or smth,
vi nginx-pod.yaml
And then you actually create the object out of the yaml file:
k create -f ngnix-pod.yaml
Application Design and Build]
Here are the modules for this part of the cert.
- Container Images
- Pods
- Jobs and CronJobs
- Container Storage
- Multi-Container Pods
- Labels and Annotations
Container Images
Image and Container Management
Glossary.
- Container: package and app into a single unit
- Container Runtime Engine: sw that executes your container (docker engine)
- Container Orchestrator: automates and mages workload (k8s)
- ContainerFile: Instructions to build the container
- Container Image: packages app into a single unit of sw including its runtime, env and config
- Container Registry: where to share your container
Render local images you have in your machine.
docker images
Before pushing a docker container image to a registry we need to conform to the conventions of the registry
For example, for docker registry you need to prepend your container image with your username:
docker tag python-hello-world:1.0.0 jose/python-hello-world:1.0.0
If you want to push your container image, you need to auth first,
docker login --username=jose
And then push it
docker push jose/python-hello-world:1.0.0
You can create a backup of container image into a .tar file
docker save -o python-hello-world.tar jose/python-hello-world:1.0.0
Then list it
$ ls
python-hello-world.tar
We can do the inverse from a file:
docker load --input python-hello-world.tar
Learnings from the Lab
Create the container
cd into the dir with the Dockerfile, then do:
docker build -t some-tag:1.0.0 .
The dot is important
You can double check if you did it right with
$ docker images
REPOSITORY           TAG       IMAGE ID       CREATED         SIZE
nodejs-hello-world   1.0.0     3af6d05d3c35   8 minutes ago   180MB
Then to actually run the thing,
docker run -d -p 80:3000 nodejs-hello-world:1.0.0
Keep in mind that all the flags go before the image tag, if not it will trip
To list the running containers you can do
$ docker container ls
CONTAINER ID   IMAGE                      COMMAND                  CREATED         STATUS         PORTS                                   NAMES
c02c36ecbc85   nodejs-hello-world:1.0.0   "docker-entrypoint.s…"   3 minutes ago   Up 3 minutes   0.0.0.0:80->3000/tcp, :::80->3000/tcp   angry_mestorf
To stop it you can do
docker container stop angry_mestorf
Saving to a tar file:
docker save -o nodejs-hello-world-1.0.0.tar nodejs-hello-world:1.0.0
Pods
Go read more on pods here
Running and config applications in containers with pods
Creating a pod with imperative command (probably we will never do this?)
$ k run hazelcast \
    --image=hazelcast/hazelcast \
    --restart=Never \
    --port=5701 \
    --env="DNS_DOMAIN=cluster" \
    --labels="app=hazelcast,env=prod" \
In yaml would look something like this.
apiVersion: v1
kind: Pod
metadata: v1
    name: hazelcast
spec:
    containers:
    - image: hazelcast/hazelcast
    - name: hazelcast
      ports
      - containerPort: 5701
    restartPolicy: Never
The container runtime engine will download the image from the registry and store it in that pod.
Pod Life Cycle Phases
Pending -> Running -> Succeeded
                  |
                   -> Failed
Create a temporary pod, for experimentation, for example here we create a pod to see if it can communicate with the ip provided.
k run busybox \
    --image=busybox \
    --rm \ # this will  remove the pod after creation
    -it
    --restart=Never
    -- wget 10.1.0.41
We can overwrite the entry point of a container, in the manifest
# more stuff
spec:
    containers:
    - image: some/image
      name: spring-boot
      command: ["/bin/sh"]
      args: ["-c", "while true; do date; sleep 10; done"]
Here we use command and args to overwrite the entrypoint.
If you want to delete a pod without graceful deletion, you can do:
k delete -f pod.yaml --now
Namespace
Groups resources for ease of organize.
Namespaces starting with kube- are not consider end user-namespaces, when
you are a developer you wont need to interact with those.
If you delete a namespace, everything that it contains will be deleted as well
Jobs and CronJobs
One-time operations and scheduled operations.
Here is the difference between these k8s primitives.
- Pod: we use this for continuous operation, for example a web app that has an API on it.
- CronJob: a job we run periodically, for example: running a database backup
- Job: runs only one time, for example, import/export data processes.
Job
We define a number of completions of a job and the actual work wont be consider to be comleted until we reach that number of completions.
The work is managed by a Job but it will still run inside a Pod
K8s will not delete these objects once they finish, this helps for debugging purposes.
To create a job imperative:
$ k create job \
    counter \
    --image=ngnix:1.24
    -- /bin/sh -c 'counter=0; while [ $counter -lt 3 ]; do \
       counter=$((counter+1)); echo "$counter"; sleep 3; done'
apiVersion: batch/v1
kind: Job
metadata:
    name: counter
spec:
    completions: 1
    parallelism: 1 # do we want this to be exectued in parallel
    backoffLimit: 6 # if fails n times, mark it as failed
    template:
        spec:
            restartPolicy: OnFailure # restart pod when fail or start a new pod
            contianers:
            - args:
                - /bin/sh
                - -c
                - ...
                image: nginx:1.24.0
                name: counter
There are different operation types for a job. The default behaviour is to run in a single pod and expect one successful operation. But we can:
spec.completionschange the number of times we want to execute itspec.parallelismexecuting a workload by multiple pods in parallelspec.backoffLimitnumber of retries until the job is marked as successfulspec.template.spec.restartPolicyneed to be declared explicitly, can only beOnFailureorNeverspec.activeDeadlineSecondsif the job is not completed in this amount of time, terminate it. This takes precedence overbackoffLimit
You can check the events of a job either from the description or with this:
k events --for job/printer -n batch
CronJob
It is a primitive for executing workloads periodically. It uses the same notation as unix for repetition.
The cronjob will create Jobs, so we can do k get jobs and see the ones that
the cronjob has created
We can retain history for the jobs. The default for the successful ones is
(spec.successfullJobsHistoryLimit) set to 3.
The default for the failed ones (spec.failedJobsHistoryLimit) is 1
Imperative command to create a cronjob.
k create cronjob current-date \
    --schedule="* * * * *"
    --image=nginx:1.24.0.0
    -- /bin/sh -c 'echo "Current date: $(date)"'
Container Storage
Volumes
The containers have a temporary file system, if you restart the container the file system will be deleted.
- Ephemeral Volumes: exist for the lifespan of a pod. Useful for sharing data between multiple containers running in a pod
- Persistent Volumes: preserve data beyond the lifespan of a pod.
Define a volume using spec.volumes[] and then reference it in a container
with spec.containers[].volume.volumeMounts
Volume Types
There are a lot, some are only offered by certain cloud providers.
Some of the common ones:
emptyDir: Empty dir in a pod with read/write access. Ephemeral.hostPath: Point to a file in the host.configMap: Mount config datanfs: provide a network file system. Persistent.
Ephemeral Volume
We need to define the volume first in spec.volumes and then reference it
inside spec.containers.volumeMounts
Here is an example:
apiVersion: v1
kind: Pod
metadata: Pod
    name: my-container
spec:
    volumes:
    - name: logs-volume
      emptyDir: {}
    containers:
    - image: nginx
      name: my-container
      volumeMounts:
      - mounthPath: /var/logs
        name: logs-volume
Persistent Volume
We need to create two more objects to create this type of volume.
PersistentVolume(PV): piece of storage in the cluster provisioned by an adminPersistentVolumeClaim (PVC): consumes PV, similar to how a pod consumes node resources (cpu, memory) here thepvcconsumes storage from apv
There are different ways on how we can provision this type of storage.
- static provisioning: we create the
PersistentVolumeobject by ourselves. - dynamic provisioning: automatically creates the
PersistentVolumeobject - storage class: obj/s that already exist in the k8s cluster. (setup by admin)
Defining a PersistentVolume
We need to set capacity, access mode, and host path
apiVersion: v1
kind: PersistentVolume
metadata:
  name: db-pv
spec:
  capacity:
    storage: 1Gi
  accessModes:
    - ReadWriteOnce
  hostPath:
    path: /data/db
Access Modes:
ReadWriteOnce: rw by single nodeReadOnlyMany: r by many nodesReadWriteMany: rw by many nodesReadWriteOncePod: rw mounted by a single pod
Reclaim Policy:
Retain: default. When PVC (persisted volume claim) is deleted the pv is released and can be reclaimed.Delete: Deletion removes PV and associated storage.
How to use it.
So once we have our pv, we need to create a pvc to claim storage from that
pv.
apiVersion: v1
kind: PersistentVolumeClaim
metadata:
  name: db-pvc
spec:
  accessModes:
    - ReadWriteOnce
  resources:
    requests:
      storage: 8Gi
  storageClassName: "" # empty means we will use a statically-created pv
When we create it we need to check that the state is Bound.
In the pod, we create the volume as regular and assign it to the container.
apiVersion: v1
kind: Pod
metadata:
  name: mypod
spec:
  volumes:
    - name: app-storage
      persistentVolumeClaim:
        claimName: db-pvc # reference the volume by pvc name
  containers:
    - name: myfrontend
      image: nginx
      volumeMounts:
      - mountPath: "/mnt/data"
        name: app-storage
Multi-Container Pods
In general we want to define 1 container per pod. That is the case when we want to operate a microservice on that container.
But there are reasons to run multiple ones. For example, helper containers, run setup scripts, stuff like that.
Design Patterns
Emerged from pod requirements
-
Init Container: initialization logic, that need to be run before the main app starts.
- Example: Downloading config files required by the application.
-
Sidecar: containers not part of the main traffic the app receives, but will run along side the main app
- Example: Watcher capabilities.
-
Adapter: Transform output produced by app into another format or smth that makes it more usable for another program.
- Example: Massaging log data
-
Ambassador: Provides a proxy for communicating with external services. To abstract complexity.
- Example: providing credentials for auth.
Init Container
To define an initContainer you need to add this to your yaml.
apiVersion: v1
kind: Pod
metadata:
  name: myapp
spec:
  initContainers:
  - name: app-init
    image: busybox:1.28
    command: ['sh', '-c', "wget something.com/res.png"]
  containers:
  - name: myapp-container
    image: busybox:1.28
    command: ['sh', '-c', 'echo The app is running! && sleep 3600']
When we start the pod, under STATUS you can see Init:0/1 meaning it is
creating the containers needed.
We can talk with any of the containers using --contianer or -c.
k --container=init
k --container=app
Labels and Annotations
Labels:
- Key value pairs that can be assigned to an object
- They need to follow a naming convention, we can use them to filter objects
Annotations:
- Represent human-readable metadata
- Not meant for query
Labels
We can assign it with the imperative label command, or with
metadata.labels[].
Not meant for elaborate. They have a max of 63 characters.
We can add a label imperatively with:
k label pod nginx tier=backend env=prod app=viraccle
See pods with labels
k get pods --show-labels
To remove a label you put the key and a minus sign
k label pod nginx tier-
From a manifest.
apiVersion: v1
kind: Pod
metadata:
  name: label-demo
  labels:
    environment: production
    app: nginx
We can use them to query stuff.
$ k get pods -l tier=frontend,env=dev --show-labels
$ k get pods -l version --show-labels # only the key
$ k get pods -l 'tier in (frontend,backend),env=dev' # create a query
There is other k8s objects that enforce policies or smth, and that can also use
the labels to select to which pod you want to enforce them. For example a
NetworkPolicy can have spec.podSelector.matchLabels.mylabel: frontend.
Annotation
Metadata without the ability to be queryable. Make sure to put the annotation in quotes, for handling spaces and stuff.
A example could be the author, a commit hash, or a branch.
$ k annotate pod nginx commit='866a8dc' branch='users/jloca/bug'
If we describe the object we will see our annotations there.
There are some well-known annotations, pod-security.kubernetes.io/warn: baseline
but that goes out of the scope of the course.
🐦 Application Deployment
Deployments
Managing a set of pods with the same config (called replicas) we want to make sure we have the same config for these replicas.
We can scale up or down the number of replicas to fulfill our reqs. Updates to a replica config can be easily rolled out automatically.
Under the hood, we say
deployment, "create 3 replicas"ReplicaSet, "maintain stable set of 3 pods"pod, "3 pods with the same definition"
How do we create them imperatively:
k create deployment my-deploy --image=nginx --replicas=3
The default --replicas is 1
The yaml would look like this:
apiVersion: apps/v1
kind: Deployment
metadata:
  name: nginx-deployment
  labels:
    app: nginx
spec:
  replicas: 3
  selector:
    matchLabels:
      app: nginx
  template:
    metadata:
      labels:
        app: nginx
    spec:
      containers:
      - name: nginx
        image: nginx:1.14.2
        ports:
        - containerPort: 80
Everything under the spec.template is the same as the attributes for the pod
spec.
The deployment internally uses label selector spec.selector.matchLabels, it
matches against spec.template.metadata.labels.
Rolling out changes.
If you change the live object of the deployment, it will roll out the changes
of the replicasets by themselves.
It will keep a track of the changes, you can check it with:
$ k rollout history deployment my-deploy
If we make a change to the deployment, for example assign a new image.
k set image deployment my-deploy nginx=nginx:1.19.2
If you run the k rollout history command again, you will see the new
deployment.
If we want to come back to other versions, we can do
k rollout undo deployment my-deploy --to-revision=1
You can annotate what changed on each revision
k annotate deployment my-deploy kubernetes.io/change-cause="image updated to 1.17.1"
This will be displayed when listing the revisions.
Manually Scaling a Deployment
k scale deployment my-deploy --replicas=5
Or we can edit the live object of the deployment.
Autoscaling a Deployment
The deployments scale automatically based on the metrics k8s is generating.
There are a couple of types of autoscalers (which are k8s objects):
- Horizontal Pod Autoscaler (HPA): standard feature of k8s that scales the number of pod replicas based on cpu and memory thresholds. (Relevant for the exam)
- Vertical Pod Autoscaler (VPA): scales cpu and memory alloc for existing pods based on historic metrics. Supported by a cloud provider as an add-on.
Both of them use the metrics server. You need to install the component, and set the resource requests and limits.
apiVersion: autoscaling/v2
kind: HorizontalPodAutoscaler
metadata:
  name: php-apache
spec:
  scaleTargetRef: # the scaling target
    apiVersion: apps/v1
    kind: Deployment
    name: php-apache
  minReplicas: 3
  maxReplicas: 5
  metrics:
  - type: Resource # the thresholds
    resource:
      name: cpu
      target:
        type: Utilization
        averageUtilization: 80
You can see them with k get hpa
Deployment Strategies
-
ramped: we will touch one replica at a time and update the config needed.
- pros: leads to no downtime. We roll out the new version to all the replicas overtime.
- cons: make sure we do not introduce breaking changes
-
recreate: terminate the old version and then create a new one with the new config
- pros: good for dev envs, everything shutdowns at once and renewed at once
- cons: can cause downtime
-
blue/green: creates a new deployment with the new version, they run along side each other, and once we are happy with the new one, we switch traffic. (you need to set up two different deployments)
- pros: no downtime, traffic can be routed when ready
- cons: resource duplication, config and network routing.
Special note on this one. When you have the two deployments, you'll need a svc that is the one that actually exposes the app, then you can just change the label selector there from blue to green (or viceversa) and k8s will do the rest for you
- canary: release a new version to a subset of users, then proceed to a full
roll out (useful for testing) (you need to set up two different deployments)
- pros: new version released to subset of users.
- cons: may require a load balancer for fine-grained dist
How do we implement this?
under spec.strategy.type we define the type we want. We can configure it
there
Helm
Helm is a package manager (similar to dnf or brew). The artifact produce by helm is a chart. The chart contains the info needed to create the cluster.
They are stored in a repository. At runtime, it replaces placeholders in yaml
templates files with the actual end-user defined values.
Discovering and Installing a Public Helm Chart
You can go to artifacthub.io/packages
Search for a chart:
helm seach hub jenkins
We can add repos for helm to look into them:
helm repo add bitnami https://charts.bitname.com/bitnami
helm repo update # this will give us the latest versions of the charts
Once we add the repo we can install the chart with
helm install jenkins bitnami/jenkins
Listing installed charts
helm list
Then we can actually see the k8s objects/resources that were created by it. At any point we can choose to uninstall the charts.
We can uninstall this at any time
helm uninstall jenkins
Building and Installing a Custom Helm Chart
This is not part of the exam, but good to know. We have a Chart.yaml and it
has the meta info of the chart. Then we will have the values.yaml were we
can define specific values that need to be change at runtime.
We have another dir templates there we have all the manifests for the k8s
objects/resources.
You can just render the template helm temlpate /path/to/the/chart/.
🐤 Application Observability & Maintenance
This covers topics every dev should know once their app is in production.
API Deprecations
3 times a year k8s has a new release, this means that some of the APIs we are
using might be deprecated. If this is the case, we will see a warning when
doing the kubectl commands.
If you need to migrate to new APIs, you can search for the deprecated API migration guide.
You can see the available versions in your cluster using:
k api-versions
Be sure to check what other changes you need to do to adapt the k8s resources, sometimes you need to change something inside the manifest other than the version.
Probes
It helps with detecting and correcting application issues.
The probes will run a miniprocess that check for runtime conditions. For example, an http get request. For other apps open a tcp socket, or stuff similar like that.
The verification method is exec by kubelet.
Readiness Probe
Is the app ready to server requests?
This checks if the app is up and running, the kubelet will check the config of the readiness probe periodically.
Liveness Probe
Does the app still function without errors?
Check for deadlocks, memoryleaks. This will restart the container and try to get the app into a running state
Startup Probe
Legacy app may need longer to start. Hold off on starting the liveness probe.
Health Verification Methods
We can choose from different verification methods, in any type of probe
- custom command:
exec.command, execute a command inside the container and check the exit code - http get request:
httpGet, make a request and check if it is between 200-399 tcpsocket connection:tcpSocket, open socket at portgRPC:grpc
You can customize each of these a bit more.
initalDelaySecondsperiodSecondstimeoutSecondssuccessThreshold- number of successful attempts until probe is consider successful after a failurefailureThreshold.terminationGracePeriodSeconds- grace period before forcing a container stop upon failure.
Probes are not different objects. You need to add the config inside the container:
apiVersion: v1
kind: Pod
metadata:
  labels:
    test: liveness
  name: liveness-http
spec:
  containers:
  - name: liveness
    image: registry.k8s.io/e2e-test-images/agnhost:2.40
    args:
    - liveness # here we start
    livenessProbe:
      httpGet:
        path: /
        port: 8080
      initialDelaySeconds: 3
      periodSeconds: 3
Metrics Server
The metric server is component you have to install in a k8s cluster to retrieve metrics.
It works by the kubelets sending information (cpu, memory consuption) to the
centralized server.
To install the metrics server, you can k apply the manifest:
kubectl apply -f https://github.com/kubernetes-sigs/metrics-server/releases/latest/download/components.yaml
Once it is installed you can do
$ k top nodes # show metrics on nodes
$ k top pods # show metrics on nodes
For the Horizontal Pod Autoscaler (HPA) you need to have this installed in your cluster. Pod scheduling on clusters also sometimes need the metrics server installed. For example, when assigning cpu, memory limits.
Troubleshooting Pods and Containers
How to identify root cause of failures.
When create a new pod object
ImagePullBackOfforErrImagePull: image could not be pulled from the registry.- Verify image name
- Verify image exists
- Verify network access from node to registry
- Ensure auth is set properly
CrashLoopBackOff: app or command run in container and crashes- Check the command is executed properly
CreateContainerConfigError:configmaporsecretby container cannot be found- check correct name of the config obj
- verify the existence of the config obj in the namespace
Inspecting Events of a Specific Pod
k get events
Will list the events across the pods. You can also check the logs of the pod.
Go inside the pod with k exec -it.
To debug a container that does not expose a shell. We can use:
k debug mypod -it --image=busybox
this will create an interactive debugging session in pod mypod and
immediately attach to it.
You can also do k cp <namespace>/<pod>:<file> <local path> to copy files
🦉 Application Observability & Maintenance
This module account for the most points on the exam.
Custom Resource Definition (CRDs)
These are custom primitives we can introduce by extending the k8s api.
We can interact with an object that we can define, create and persist, and we the k8s api will expose it.
You need to create a controller to make them useful. This implements the
logic between your custom object and the k8s api. This combination is called
Operator pattern.
The actual controller are written in Go or Python.
Example CRD
-
Requirement: a web app stack deployed via a Deployment with one or more replicas. There is a Service object that routes network traffic to the pods.
-
Desired Functionality: After the deployment happened, we want to run a quick smoke test against Service's DNS names, to see everything is okay. The result of the test will be send to an external service for rendering a UI.
-
Goal: Implement the Operator pattern (CRD and controller)
apiVersion: apiextensions.k8s.io/v1
kind: CustomResourceDefinition
metadata:
  # name must match the spec fields below, and be in the form: <plural>.<group>
  name: crontabs.stable.example.com
spec:
  # group name to use for REST API: /apis/<group>/<version>
  group: stable.example.com
  # list of versions supported by this CustomResourceDefinition
  versions:
    - name: v1
      # Each version can be enabled/disabled by Served flag.
      served: true
      # One and only one version must be marked as the storage version.
      storage: true
      schema:
        openAPIV3Schema:
          type: object
          properties:
            spec:
              type: object
              properties:
                cronSpec:
                  type: string
                image:
                  type: string
                replicas:
                  type: integer
  # either Namespaced or Cluster
  scope: Namespaced
  names:
    # plural name to be used in the URL: /apis/<group>/<version>/<plural>
    plural: crontabs
    # singular name to be used as an alias on the CLI and for display
    singular: crontab
    # kind is normally the CamelCased singular type. Your resource manifests use this.
    kind: CronTab
    # shortNames allow shorter string to match your resource on the CLI
    shortNames:
    - ct
Useful tips
Once you create it, you can see it if you list the api-resources
k api-resources
Then when you create an object you can list it with the spec.names.singular
or spec.names.plural you defined in the CRD's manifest. So if the name was
my-custom-obj you could do:
k get my-custom-obj
One last thing, to know what is the version you should put in the object manifest you can do.
k api-resources | grep my-custom-obj
And it will list it there in the second column.
Authentication and Authorization
Access control for the k8s api.
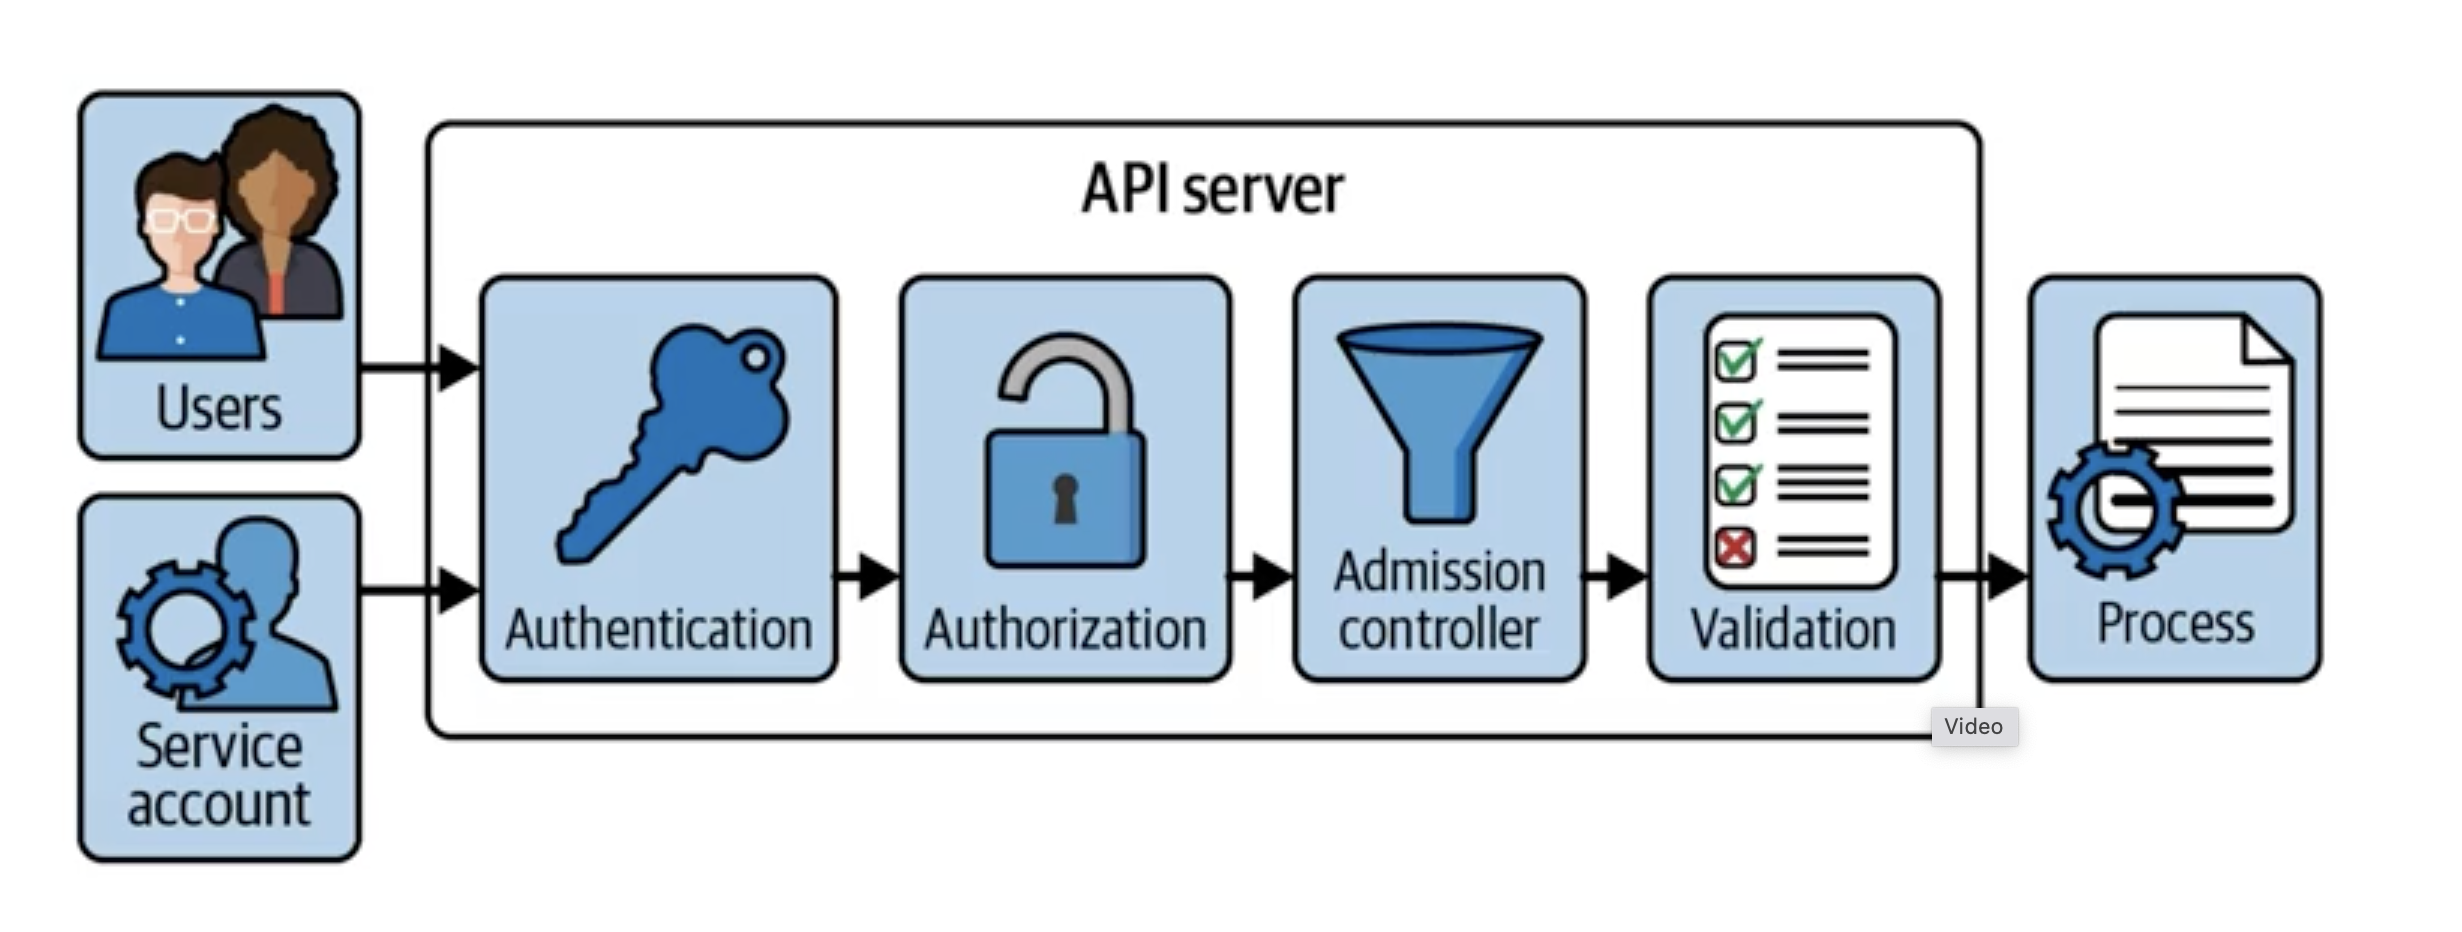
This process has 4 steps.
- Authentication: checks that the identity of the client is valid.
- Authorization: okay, your identity is good, but do you have access to what are trying to do? (Here it comes into place RBAC, read below for more info)
- Admission Control: you have access alright, did you send the request in a well-formed manner?
- Validation: checks that the resource included in the request is valid.
- Authentication via credentials in kubeconfig
- Role-based Access Control (RBAC)
- Using a ServiceAccount with RBAC
Authentication via credentials in kubeconfig
Some useful commands:
k config view # renders the contents of the kubeconfig file
k config current-context # shows the currently-selected context
k config user-context johndoe # switch context
Inside .kube/config we can see a yaml
clusters.cluster.server: api server endpoint for connecting with a cluster.contexts.context: groups access paramscontexts.context.cluster: name of the clustercontexts.context.user: user name
contexts.name: name of the context
Here is an example of a kind cluster.
apiVersion: v1
clusters:
- cluster:
    certificate-authority-data: <token>
    server: https://127.0.0.1:51224
  name: kind-kind-cluster
contexts:
- context:
    cluster: kind-kind-cluster
    user: kind-kind-user
  name: kind-kind
current-context: kind-kind
kind: Config
preferences: {}
users:
- name: kind-kind-user
  user:
    client-certificate-data: <cert>
    client-key-data: <cert>
Role-based Access Control (RBAC)
RBAC works after the authentication process. Now that we know the credentials are valid we have to ask. Does this user have permission to do this?
RBAC defines policies for users, groups and processes, that allow or
disallow access to k8s objects. For exmaple there can be a group that can
only list and create pods, but not touch secrets or configmaps.
Enabling RBAC is a most for any org.
High level breakdown.
- Subject
- groups
- users
- service accounts
- API resources
- configmap
- pod
- deployment
- Operations
- create
- list
- watch
- delete
There are 2 k8s resources/objects we care about.
roles: define the rolerolebining: attach the role to a user.
This are namespace scoped. If you want to do this but in all the cluster
then we have cluster and clusterolebinding.
In this case, creating the resources with the imperative command is easy:
k create role read-only --verb=list,get,watch --resource=pods,deployment,services
Then to bind it:
k create rolebinding read-only-binding --role=read-only --user=johndoe
Of course we can describe, get, and any other operation you can do to any other k8s resource/obj.
Using a ServiceAccount with RBAC
A service account is a non-human account that interacts with the kubernetes cluster.
Entities outside or inside the cluster (pods, system components, etc) can use specific credentials to identify as ServiceAccount's.
How to use the service accounts.
- Create a
serviceaccountobject - Grant permissions to the ServiceAccount object using RBAC
- Assign the ServiceAccount object to a pod during its creation or retrieve the SerivceAccount token and use if from an external service.
How do you assign it to a pod?
Under spec.serviceAccountName you add the name of the service account name.
How do you retrieve it for an external service?
k describe pod list-pods -n k97
k exec -it list-pods -n k97 -- /bin/sh
# cat /var/run/secrets/kubernetes.io/serviceaccount/token
eyJShAthetoken...
Note. To get the API server endpoint from within the cluster you can do
k get service kuberentes.
Resource Management
Resource requests and limits, resource quotas and limit range.
Here we will cover:
-
Define min and max resources needed to run a container. We just need to modify the definition of a pod.
-
ResourceQoutaconstrain resources on a namespace-level. -
LimitRangeconstrains resource alloc for a single object
Resource Units in K8s
K8s measures: CPU in millicores and memory resource in bytes.
1 CPU unit is equivalent to 1 physical CPU core, or 1 virtual core, depending on whether the node is a physical host or a virtual machine running inside a physical machine.
Container Resource Request (min)
You can define the min amount of resources needed to run an app via
spec.containers[].resources.requests
These resources include: cpu, memory, huge page, ephemeral storage
This limits influence if the pod can be scheduled or not, you might see these
messages: PodExceedsFreeCPU or PodExceedsFreeMemory.
The options available are:
spec.containers[].resources.requestscpu: eg 500mmemory: eg 64Mihugepages-<size>: eg 60Miephemeral-storage: eg 4Gi
Container Resource Limits (max)
Can be defined in spec.containers[].resources.limits
These resources include: cpu, memory, huge page, ephemeral storage
Container runtime decides how to handle situation where app exceeds alloc capacity. (Maybe kill the container)
spec.containers[].resources.limitscpu: eg 500mmemory: eg 64Mihugepages-<size>: eg 60Miephemeral-storage: eg 4Gi
ResourceQuota
This is a k8s primitive, it defines resources constrains for an specific namespace. This is usually done by the admin.
apiVersion: v1
kind: ResourceQuota
metadata:
  name: my-quota
  namespace: this-ns
spec:
  hard:
    pods: "2"
    requests.cpu: "2"
    requests.memory: 1024Mi
    limits.cpu: 4
    limits.memory: 4096Mi
If the there is a resource quota, then all the resources it covers must define
limits and requests so the resource quota can do the math. It wont allow us
to create the objs otherwise.
LimitRange
So basically resourcequota is for namespaces, but you can micro manage it
more with limit ranges you can specify for each object within a namespaces the
resource allocation.
You can apply default values that will be set if no explicit declaration is set in the specific object manifest. As well as global min and max.
For example this will
apiVersion: v1
kind: LimitRange
metadata:
  name: cpu-resource-constraint
spec:
  limits:
  - default: # this section defines default limits
      cpu: 500m
    defaultRequest: # this section defines default requests
      cpu: 500m
    max: # max and min define the limit range
      cpu: "1"
    min:
      cpu: 100m
    type: Container
Configmaps and Secrets
K8s primitives for configuration data that we can inject into a pod.
They have some characteristics:
- stores as key pair values.
- stored decoupled from consuming pod
- configmap: plain text values for config apps, flags, URLs, etc.
- secret: Base64-enconded values, for API keys or SSL certificates. The values are not encrypted.
- they are stored in
etcdunencrypted, but you can encrypt them if you want.
Once we create the object we can mount is as a volume or as env variables.
Imperative Approach
k create configmap db-config --from-literal=db=staging
you have multiple options:
--from-env-file=config.env
--from-file=app-config.json
--from-file=some-dir # a dir
Once you create it, you can mount it in a pod like this:
apiVersion: v1
kind: Pod
metadata:
  name: env-configmap
spec:
  containers:
    - name: app
      command: ["/bin/sh", "-c", "printenv"]
      image: busybox:latest
      envFrom:
        - configMapRef:
            name: myconfigmap
You can also get specific keys from a configmap using configMapKeyRef
apiVersion: v1
kind: Pod
metadata:
  name: env-configmap
spec:
  containers:
    - name: app
      command: ["/bin/sh", "-c", "printenv"]
      image: busybox:latest
      env:
      - name: DATABASE_URL
        valueFrom:
            configMapKeyRef:
              name: backend-config
              key: database_url
In this example we are using the key database_url from the config map
backend-config and setting it in the env as DATABASE_URL in caps.
Consuming Changed ConfigMap Data
Containers will not refresh data upon a change. You would have to develop that on your app, like refresh the env variables periodically or on-demand.
Secrets
There are these secrets:
generic, creates a secret from a file, directory or literal valuedocker-registry, creates a secret for a docker registrytls, creates a tls secret
Imperative commands
k create secret generic db-creds --from-literal=pwd=s3cre
Also we have specialized secret types, they are set using the --type
attribute in manifest.
kubernets.io/basic-auth, credentials for basic authkubernets.io/ssh-auth, credentials for sshkubernets.io/service-account-token, serviceaccount tokenkubernets.io/token, node bootstrap token data
If you create a secret yaml by hand you need to encode the value yourself.
echo -n 's3cre!' | base64
If you don not want to do that you can also provide the data stringData in
the yaml, and k will encrypt it once you k apply it.
Security Context
Privilege and access control for a pod. For example This container needs to run with a non-root user.
These are defined in spec.securityContext or
spec.containers[].securityContext.
Some attributes on the Pod and container level are the same. Container-level ones take precedence.
Defining Container Security
There is a Security Context API
- PodSecurityContext: pod level security attr.
- SecurityContext: container level security attr.
apiVersion: v1
kind: Pod
metadata:
  creationTimestamp: null
  labels:
    run: busy-security-context
  name: busy-security-context
spec:
  securityContext:
    runAsNonRoot: true
    runAsUser: 1000
    runAsGroup: 3000
    fsGroup: 2000
  containers:
  - args:
    - sleep
    - "1h"
    image: busybox:1.28
    name: busy-security-context
    volumeMounts:
    - mountPath: /data/test
      name: volume-empty
    resources: {}
  volumes:
  - name: volume-empty
    emptyDir: {}
  dnsPolicy: ClusterFirst
  restartPolicy: Always
status: {}
🦕 Services & Networking
What service k8s primitive is and troubleshooting it. We will also check
ingresses, to finally go to network policies (firewall rules form pod to pod
comms).
Services
It is providing a stable network endpoint to one or many pods.
When a pod restart the IP changes, so we cannot rely on those. There is a k8s primitive that provides discoverable names and load balancing to a set of Pods. It's called Service
Exposing a Network Endpoint to Pods
Request routing, the service uses label selection to see which pods can it use.
We also need to do port mapping. contianerPort is the port in the container,
targetPort is the port in the service. They need to be the same.
Imperative approach.
k create service clusterip echoserver --tcp=80:8080
Or we can create a pod and a service from one shot.
k run echoserver --image=some-image --port=8080 --expose
This is the manifest approach.
apiVersion: v1
kind: Service
metadata:
  name: my-service
spec:
  selector:
    app.kubernetes.io/name: MyApp
  ports:
    - protocol: TCP
      port: 80
      targetPort: 9376
Service Types (How can we export the service)
ClusterIP: exposes the service on a cluster-interal ip. Meaning it will only be reachable from pods within the cluster (this is the default).NodePort: Exposes the service on each node's IP at a static port.LoadBalancer: Exposes the service externally using a cloud provider's load balancer.
Troubleshooting Services
We will see how to root cause failures for services.
Try to list the service, and see the service type. Then make a call to the service (using an ephemeral pod).
There is a command get endpoints. It will render all the virtual ip of pods a
service should be able to route.
If we see <none> we have issues with connecting the pod.
2 sources of misconfiguration:
- label selector,
targetportdoes not match with the container port.
Check the network policies. k get networkpolicies, make sure it says none
Make sure the pods are running.
Ingresses
Basically it routes to which service it should go based on the endpoint.
It simply routes traffic to the svc we have in our cluster, we expose them with
http. It is NOT a service type and should not be confused with LoadBalancer.
Defines rules for mapping URL context path to one or many service objects.
Not TLS by default.
The ingress cannot work without an Ingress Controller. We can have multiple ingress controllers in a cluster.
Imperative approach
k create ingress corellian --rule="start-alliance.com/corellian/api=my-service-corellian:8080"
It looks better on yaml
apiVersion: networking.k8s.io/v1
kind: Ingress
metadata:
  name: mydomain
spec:
  rules:
  - host: "mydomain.com"
    http:
      paths:
      - pathType: Prefix
        path: "/end/point"
        backend:
          service:
            name: my-service
            port:
              number: 80
See the definition of:
- host name (optional),
- list of paths, two types:
- exact:
/end/point, will match/end/pointbut no/end/endpoint/ - prefix:
/end/point, will match/end/pointand/end/endpoint/
- exact:
- backend.
Configuring DNS for an Ingress
To resolve the Ingress, you'll need to config DNS entries to the external address. There is an add-on that help you mange those DNS records called ExternalDNS.
Network Policies
By default all pods can communicate with each other. Network policies give us a declarative approach to configure which pods can communicate to each other.
It can be as broad as, this namespace can talk to this other namespace, or as specific as only the traffic on this port should enforce this policy.
Anatomy of a NetworkPolicy
The manifest basically has two parts:
- Target pods: Which pods should have the policy enforced, selected by labels.
- Rules: Which pods can connect to the target pods.
kind: NetworkPolicy
apiVersion: networking.k8s.io/v1
metadata:
  name: api-allow
spec:
  podSelector:
    matchLabels:
      app: bookstore
      role: api
  ingress:
  - from:
      - podSelector:
          matchLabels:
            app: bookstore
  - from:
      - podSelector:
          matchLabels:
            app: inventory
Gotcha's
- Empty selector will match everything, eg
spec.podSelector: {}will apply the policy to all pods in the current namespace. - Selector can only select pods that are in the same namespace.
- All traffic is allowed until a policy is applied.
- There are no deny rules in NetworkPolicies. NetworkPolicies are deny by default. Meaning "If you are not on the list you can not get in."
- If a NetworkPolicy matches a pod but has a null rule, all traffic is blocked.
What to focus on each topic.
- Containers
- Pods and Namespaces
- Cronjob and jobs
- Volumes
- Multi-Container Pods
- Labels and Annotations
- Deployments
- Helm
- API Deprecations
- Probes
- Metrics Server
- Troubleshooting
- CRDs
- Authentication and Authorization
- Resource Management
- ConfigMaps and Secrets
- Security Context
- Services
- Troubleshooting Services
- Ingresses
- Network Policy
Containers
- Practice with docker engine
- Understand the most important instructions used in a dockerfile
- Know hot to build a container image from a dockerfile
- Learn how to save a container image to a file and how to load a container from a file
Pods and Namespaces
- Practice command for creating, edit, inspecting and interacting with a Pod
k runallows for fast creation of pod- Understand diff life cycles to be able to quickly diagnose error conditions
Cronjob and jobs
- The actual job is executed in pods.
- Understand the different operational types (parallel, completion) for jobs can be tricky.
- Force yourself into setting up all possible scenarios and inspect their runtime behaviour.
- Know how to configure and inspect the retained job history.
Volumes
- Understand different use cases for wanting to use ephemeral or persistent.
- Practice the most common volume types. (
emptyDir,hostPath). - Go to the process of dynamic and static binding.
- static, you need to create the pv
- dynamic, automatically created the pv
Multi-Container Pods
- The attributes that can be assigned to an
initContainerssection are the same as the containers section - Design patterns (Sidecar, Ambassador, etc). When to use and how to implement.
Labels and Annotations
- Some primitives, Deployment, Service and Network Policy, use label selection heavily.
- Annotations are not made for querying, some reserved annotations may influence runtime behaviour.
Deployments
- When creating a deployment make sure label selection match with the pod template.
- Practice how to scale the number of replicas manually
--replicasor viahpafor thresholds. - be aware of the
k rollout undo. - know how to apply the deployment strategies.
Helm
- Just know that helm is an open source tool for installing a set of
yamlmanifests. - Practice discovering and installing existing charts, using the helm executable.
API Deprecations
kubectlwill show a message if an api will be deprecated- Check the migration guide
Probes
- Understand the purpose of readiness, startup and liveness probes.
- Easy to just copy-paste the k8s docs
- Try to induce failure conditions to see the runtime effects
Metrics Server
- You wont have to install the metric server
- Understand the purpose of the metric server, and which other objects use it.
Troubleshooting
- practice relevant
kcommand to diagnose issues. - proactively expose yourself to failing pods
CRDs
- You are not expected to implement a CRD schema.
- You only need to know how to discover them and use them.
- To study, you can install an open source CRD
- for example the external secrets
Authentication and Authorization
- RBAC defines permissions for permitted operations on specific API resources
- Role and RoleBinding define permissions for objects in a namespace.
- ClusterRole and ClusterRoleBinding define permissions for objects across all namespaces.
- We can use the ServiceAccount object to run services against the k8s cluster itself. It will auth with RBAC also.
Resource Management
- 3 aspects,
- how to define min and max resources for a container.
- resource quota to limit the aggregate resource consumption or limit the overall objects created in a namespace
- limit range, constrains of defaults the resources alloc for an specific object type.
ConfigMaps and Secrets
- Understand the purpose for a configmap against a secret
- Secrets are meant to represent sensitive data. They are not encrypted
- How to define those configmaps and secret objects. How to interact with them.
Security Context
- The security context lest you provide privilege and access control to containers.
- You can define it to the whole pod or to individual containers.
- Know where to find the security attributes. (k8s docs)
Services
- Pod to Pod communication should not be performed with the pod virtual ip address, due to it changing.
- We can expose the
svcs between the pods withclusteripor expose it withnodeport. We can also expose them to aloadbalancer
Troubleshooting Services
- Check for misconfiguration. The
k get endpointsis a good ally. - Check labels
- Check outgoing ports
- Make sure the app running inside the pod works.
Ingresses
- Ingress routes http traffic towards one or many services.
- Ingress doesn't work without an ingress controller
- Configuring TLS is not req for the exam
Network Policy
- Restrictions for pods talking to each other.
- Its best practice to create a deny all policy.
- You can then go ahead and open access, pod by pod.
🐋 k8s up and running
⚠️ These are notes taken from the book Kubernetes Up and Running by Brendan Burns, Joe Beda, and Kelsey Hightower O'Reilly. Please go read it and just use this as reference.
Introduction
It has become the standard API for building cloud native applications. It provides the software needed for build and deploy, reliable, scalable distributed systems.
Distributed systems: Most services nowadays are delivered via the network, they have different moving parts in different machines talking to each other over the network via APIs.
Reliable: Since we rely a lot on these distributed systems, they cannot fail, even if some part of them crashes, they need to be kept up and running, and be fault-tolerant
Availability: They must still be available during maintenance, updates, software rollouts and so on.
Scalable: We live in a highly connected society, so these systems need to be able to grow their capacity without radical redesign of the distributed systems.
Most of the reasons people come to use containers and container orchestration like k8s, can be boil down to 5 things: velocity, scaling, abstracting your infra, efficiency, cloud native ecosystem
Development Velocity
Today software is delivered via de network more quickly than ever, but velocity is not just a matter of raw speed, people are more interested in a highly reliable service, all users expect constant uptime, even as the software is being updated.
Velocity is measures in term of the number of things you can ship while maintaining a highly available service.
k8s give you the tools to to do this, the core concepts to enable this are:
-
Immutability
Software used to be mutable (imperative), you installed
vimusingdnfand then one day you would dodnf updateand it would add modifications on top of the binary that you already have forvim. This is what we call mutable software.On the other hand, immutable software, you would not add on top of the previous release, you would build the image from zero. Which is how containers work. Basically when you want to update something in a container, you do not go inside it and do
dnf update vimyou create a new image with the version of vim you want, destroy the old one, and create a container with the new one.This makes rollbacks way easier, and it keeps tracks of what changed from version to version.
-
Declarative Configuration
This is an extension of immutability but for the configuration. It basically means that you have a file where you defined the ideal state of your system. The idea of storing this files in source control is often called “infrastructure as code”.
The combination of declarative state stored in a version control system and the ability of k8s to make it match the state makes rollback super easy.
-
Self-Healing Systems
K8s will continuously take action to make sure the state on the declarative configuration is met. Say it has declared 3 replicas, then if you go and create one extra, it will kill it, and if you were to destroy one, it would create it.
This means that k8s will not only init your system but will guard it against any failures that might destabilize it.
Scaling Your Service and Your Teams
K8s is great for scaling because of its decoupled architecture.
Decoupling
In a decoupled architecture each components is separated from each other by defined APIs and service loads
This basically means that we can isolate each service.
- The API provide a buffer between implementer and consumer.
- Load balancing provide a buffer between running instances of each service.
When we decouple the services, it makes it easier to scale, since each small team can focus on a single microservice
Scaling for Applications and Clusters
Since your app is deployed in containers, which are immutable, and th configuration o is also declarative, scaling simply becomes a matter of changing a number in a configuration file. Or you can even tell k8s to do that for you.
Of course k8s will be limited to the resources you have, it will not create a physical computer on demand. But k8s makes it easier to scale the cluster itself as well.
Since a set of machines in a cluster are identical and the apps are decoupled from the specifics of the machine by containers, scaling a cluster is just a matter of provisioning the system and joining it to a cluster.
K8s can also come in handy when trying to forecast costs on growth and scaling. Basically, if you have different apps that need to scale from many teams, you can aggregate them all in a single k8s, and try to forecast the usage of the 3 apps together.
Scaling Development Teams
Teams are ideal when using the two-pizza team when (6 to 8 people), larger teams tend to have issues of hierarchy, poor visibility, infighting and so on.
K8s can help with that, since you can have multiple small teams working on different microservices and aggregate them all into a single k8s cluster.
K8s has different abstractions that make it easier to build decoupled microservices.
- pods: are groups of containers, can contain images developed by different teams into a single deployable unit.
- k8s services: provide load balancing, naming and discovery to isolate the microservices.
- namespaces: provide isolation and access control, so that each microservice can control the degree to which other services interact with it.
- ingress: easy to use front end that can combine microservices into a single API.
Separation of Concerns for Consistency and Scaling
K8s leads to greater consistency for the lower levels of the infrastructure. Basically the devs need to only worry about their app meeting the SLA (service level agreements) while the orchestration admin only need to worry about reaching the SLA from their side.
Abstracting You Infrastructure
When you build your app in terms of containers and deploy it via k8s APIs, you make moving your app between environments super easy. It is simply a question of sending the declarative config to a new cluster.
K8s make building deploying and managing your app truly portable across a wide variety of environments
Efficiency
Efficiency is measured by the ratio of the useful work performed by a machine.
K8s enables efficiency in multiple ways. Since developers do not need to use a whole machine for himself/herself, but rather one container, multiple users can share the same baremetal. Meaning less idle CPUs.
Cloud Native Ecosystem
K8s is open source and has a huge community building a thousand things on top of it. You can check the maturity of different projects in Cloud Native Computing Foundation. The maturities are sandbox incubating and graduated, going from less mature to most mature.
Summary
Fundamentally k8s was design to give developers more velocity efficiency and agility. Now that we have seen why to use it, lets see how to use it.
Deploying a k8s cluster
You can use a cloud provider, deploying on bare-metal quite hard, other good alternatives.
http://kind.sigs.k8s.io that has a really cool logo, and works on using containers for the nodes.
Go check the pages of cloud providers on how to deploy it there since it will change depending on the provider.
One thing to bare in mind is that in order to use kubectl with your cluster
you need a ~/.kube/config file, probably your cloud provider will give that
to you.
Also you can go to k8s cheatsheet (describe cluster) to see the basics commands on describing a cluster.
I will just cover some of the commands here, like
k describe nodes <node name>
At the top you can see basic node info:
Name:               kind-control-plane
Roles:              control-plane
Labels:             beta.kubernetes.io/arch=arm64
                    beta.kubernetes.io/os=linux
                    kubernetes.io/arch=arm64
We can see that it is linux on ARM
Next we can see info about the operation of the node
Conditions:
Type             Status  LastHeartbeatTime  LastTransitionTime Reason                       Message
----             ------  -----------------  ------------------ ------                       -------
MemoryPressure   False   29 Apr 2024        29 Apr 2024        KubeletHasSufficientMemory   kubelet has sufficient memory available
DiskPressure     False   29 Apr 2024        29 Apr 2024        KubeletHasNoDiskPressure     kubelet has no disk pressure
PIDPressure      False   29 Apr 2024        29 Apr 2024        KubeletHasSufficientPID      kubelet has sufficient PID available
Ready            True    29 Apr 2024        29 Apr 2024        KubeletReady                 kubelet is posting ready status
Here we can see that the node is Ready, that it has sufficient memory, it has no disk pressure, and that is has sufficient PID.
Then we see info about the capacity of the system.
Capacity:
cpu:             1
memory:          1933908Ki
pods:            110
Allocatable:
cpu:             1
memory:          1933908Ki
pods:            110
Then info about software in the node like OS image, docker version all that.
System Info:
# more stuff
Kernel Version:             6.5.6-200.fc38.aarch64
OS Image:                   Debian GNU/Linux 12 (bookworm)
Operating System:           linux
Architecture:               arm64
Container Runtime Version:  containerd://1.7.13
Kubelet Version:            v1.29.2
Kube-Proxy Version:         v1.29.2
Then info about the pods running on the node:
Non-terminated Pods:          (9 in total)
Namespace                   Name                                          CPU Requests  CPU Limits  Memory Requests  Memory Limits  Age
---------                   ----                                          ------------  ----------  ---------------  -------------  ---
kube-system                 coredns-76f75df574-92286                      100m (10%)    0 (0%)      70Mi (3%)        170Mi (9%)     23s
kube-system                 coredns-76f75df574-m2z2k                      100m (10%)    0 (0%)      70Mi (3%)        170Mi (9%)     23s
kube-system                 etcd-kind-control-plane                       100m (10%)    0 (0%)      100Mi (5%)       0 (0%)         39s
kube-system                 kindnet-qm29d                                 100m (10%)    100m (10%)  50Mi (2%)        50Mi (2%)      23s
kube-system                 kube-apiserver-kind-control-plane             250m (25%)    0 (0%)      0 (0%)           0 (0%)         39s
# more stuff
We can see that k8s tracks both requests and upper limits for resource for
each Pod. The difference is that resources requested by a pod are guaranteed to
be present in the node, while pod's limit is the max amount of given resource
that pod can consume
Cluster Components
Many components that make up the k8s cluster are actually deployed using k8s itself. All of them run in the kube-system namespace
-
k8s proxy
It routes network traffic to load-balanced services in the k8s cluster. It must be present on every node in the cluster
% k get daemonSets --namespace=kube-system kube-proxy -
k8s dns
provides naming and discover for the services that are defined in the cluster
% k get deployments --namespace=kube-system coredns
Common kubectl commands
I will repeat the commands here and in the page: k8s cheatsheet but I will go a bit more into detail here. I will also
alias k=kubectl
kubectl is the way you talk with k8s API. Here we will go over basic
kubectl commands.
Namespaces
Namespaces are like folders that hold a set of objects. They are used to organize the cluster.
By default the kubectl command interacts with the default namespace, but
you can specify which you want to use by -n or --namespace=<ns>.
You can also use --all-namespaces flag to refer to all the ns.
Contexts
If you want to change the namespaces in a more permanent way, you can use
contexts. These get recorded in your ~/.kube/config file. (That file also
stores how to find and auth to your cluster)
You can create a with a different default namespaces using
% kubectl config set-context my-context --namespace=mystuff
We need to tell kubectl to start using it.
% kubectl config use-context my-context
You can also use context to manage different clusters users for auth using
--users or --cluster flags with set-context read the man for more info
Viewing k8s API Objects
Basically k8s is an API and kubectl is just an http client. To see the k8s
objects (everything represented by a RESTful resource) we use k get <resource name>
By default it will throw to the STDOUT human readable stuff, but you can also
use -o json or -o yaml in case you want it in specific format.
Also when using awk you may want to use --no-haders.
You can also get multiple objects
k get pods,services
To get more info on a particular object
k describe <resource name> <obj name>
If you want to see like a mini man page of an specific k8s object:
% k explain pods
KIND:       Pod
VERSION:    v1

DESCRIPTION:
    Pod is a collection of containers that can run on a host. This resource is
    created by clients and scheduled onto hosts.

FIELDS:
  apiVersion	<string>
    APIVersion defines the versioned schema of this representation of an object.
    Servers should convert recognized schemas to the latest internal value, and
    may reject unrecognized values. More info:
Sometimes you want to continually observe the state of a k8s resource, like
when waiting for an app to restart of something you can use the --watch flag:
k get pods -n kube-system --watch
Creating, updating and destroying k8s objects
Objects in the k8s API are represented as JSON or YAML files. We can query the server for those, or post them with an API request.
You use these JSON and YAML files to create, update or delete objects in your k8s server.
Create an object from obj.yaml file.
% k apply -f obj.yaml
The yaml file will have the resource type of the object.
You can use the same command to update an object
% k apply -f obj.yaml
If nothing change it will not do anything, it will exit successfully, good for
for loops. You can do --dry-run to print objects to the terminal without
actually sending them.
To do interactive edits you can use
% k edit <resource-name> <obj-name>
# example k edit pod coredns-76f75df574-k97nj  -n kube-system
It will open the yaml in a text editor, wonce you save it will automatically
be uploaded back to the k8s cluster.
The apply command also has a history of the previous configurations
edit-last-applied, set-last-applied and view-last-applied for example:
% k apply -f myobj.yaml view-last-applied
To delete you can simply run
% k delete -f myobj.yaml
You can also delete an object without the file using
% k delete <resource-name> <obj-name>
Labeling and Annotating Objects
You can update the labels and annotations using label and annotate (who
would have thought).
For example to add the color=red label to the pod named bar you can run:
k label pods bar color=red
You can not rewrite unless using --overwrite flag.
Finally you can remove a label by doing
k labels pods bar color-
Debugging Commands
You can check logs from a pod by:
k logs <pod-name>
If you have multiple container in your pods you can choose which container to
view using the -c flag.
If you want to follow add -f.
You can also use the exec command to execute a command in a running
container.
k exec -it <pod-name> -- bash
If you do not have bash or a shell in your container, you can attach to a
running process
k attach -it <pod-name>
You can also copy files to and from a container using cp
k cp <pod-name>:/path/to/remote/file /path/to/local/file
This will copy a file from the container to your local machine.
You can also forward traffic from your local system to the pod
k port-forward <pod name> 8080:80
Forwards traffic from the local machine on port 8080 to the remote container on port 80
If you want to see the last 10 events in a namespace
k get events
You can also stream events --watch
Finally, to check cluster resources being used
k top nodes
or
k top pods
These commands will only work if metrics servers are present, which they likely are.
Cluster Management
Cordon and drain a particular node:
- cordon: prevent future pods form being scheduled onto that machine
- drain: remove any pods that are currently running on that machine.
Useful for removing physical machine for repairs or upgrades. You would do k cordon and then k drain to safely remove the machine form the cluster.
Once the system is back online do k uncordon there is no undrain it will
naturally get back to normal.
Pods
K8s groups multiple containers into a single atomic unit called a pod (This also goes with the docker theme, since a group of whales is a pod lol)
A pod is a collection of app containers and volumes running in the same environment. Containers in a pod always land in the same machine.
Apps running in the same pod share, ip addresses and port, hostname, and can communicate to each other using interprocess communication channels. Meaning they share:
- network namespace
- UTS namespace
- IPC namespace
Thinking in Pods
What should go in a Pod? To answer this question you go look at your different containers and ask "Will these containers work correctly if they land on different machines?" If no, then a pod is the correct way of grouping them. If yes, you can use multiple pods.
An example, say you want to deploy a wordpress app with a mysql database. Would you put them in the same pod? I already read the book so I know the answer is no, but why?
The answer is no because both of those services do not need to scale together. The wordpress app itself is stateless, so you can create more wordpress pods if you are scaling. On the other hand a mysql database is much different to scale, it can be trickier, and you are likely to increase the resources dedicated to a single mysql pod.
The Pod Manifest
Pods are describe in a manifest which is a text-file representation of the k8s API object.
As you might remember from the fist chapter, k8s uses a declarative configuration, which basically means that you tell k8s your ideal state of the world and it will take action to ensure the state becomes a reality.
When you send a manifest to k8s, it will accept it and process it before
storing it in persistent storage (etcd). The scheduler will find pods that
have not been assigned to a node, and will place the pods onto those nodes
depending on the resources and constrains you specified in your manifest. K8s
will try to ensure pods from the same app are in different machines for
reliability.
You can see the pods with
k get pods
You can delete a pod with
k delete pods/<name>
Creating a manifest
Pod manifest should be treated in the same way a source code, adding comments to help explain the pod to new team members and stuff like that.
The manifests include a couple of key fields and attributes,
metadata:name: a unique identifier for the deploymentnamespace: the Kubernetes namespace where the deployment will livelabels: key-value pairs that can be used to filter and categorize objects
spec:containers:name: a unique identifier for the containerimage: the Docker image to use for this containercommand: the default command to run in the containerargs: any additional arguments to pass to the commandvolumeMounts: mounts for persistent storage or other files
- volumes:
name: a unique identifier for the volumepersistentVolumeClaim: claims a Persistent Volume resource
selectors: used to filter which pods are included in this deployment
Example
apiVersion: v1
kind: Pod
metadata:
  creationTimestamp: "2024-04-29T20:02:16Z"
  generateName: coredns-76f75df574-
  labels:
    k8s-app: kube-dns
    pod-template-hash: 76f75df574
  name: coredns-76f75df574-k97nj
  namespace: kube-system
  # more stuff
  uid: 4dd80223-de4c-49d7-b407-31908ae96b9e
spec:
  # more stuff
  containers:
  - args:
    - -conf
    - /etc/coredns/Corefile
    image: registry.k8s.io/coredns/coredns:v1.11.1
    imagePullPolicy: IfNotPresent
    # more stuff

    volumeMounts:
    - mountPath: /etc/coredns
      name: config-volume
      readOnly: true
    # more stuff

  volumes:
  - configMap:
      defaultMode: 420
      items:
      - key: Corefile
        path: Corefile
      name: coredns
      # more stuff

status:
  conditions:
  - lastProbeTime: null
    lastTransitionTime: "2024-04-29T20:02:19Z"
    status: "True"
    type: PodReadyToStartContainers
  - lastProbeTime: null
  # more stuff
You can create a pod from them by using k apply -f manifest.yaml as seen in
previous sections.
Some Useful Commands
# get info
k get pods  # list pods
k describe pods <podname> # more info on the k8s object

# manipulate pods
k delete pods/<podname> # delete pod, all info associated to it will be deleted
k logs <podname> # check logs
k exec <podname> -- date # run date command inside pod
k exec -it <podname> -- bash # interactive tty
k cp # keep in mind that copying files into a container is an antipattern.
Health Checks
When you are running an app in k8s, it is automatically kept alive by a process health check. This ensure that the app is always running, if it is not it k8s will restart it.
Sometimes, checking if the process is alive is not enough, maybe it was left hanging or something like that. K8s has something to check application liveness and other stuff for your app.
There are different kinds of probes here are some:
-
Liveness Probe This will check app specific stuff, for example checking if http is returning 200.
While the default response to a failed liveness is to restart you can change what happened with
restartPolicyHere is an example of a
livenessProbespec: containers: - name: my-container image: my-image:latest livenessProbe: httpGet: path: /healthz port: 80 scheme: HTTP initialDelaySeconds: 30 timeoutSeconds: 5 -
Readiness Probe These probes check if an app is ready to serve user requests. Apps that fail are removed from the load balancers
-
Startup Probe Enables you to poll slowly from a slow-starting container, while also enabling responsive liveness checks once the container has initialized
Resource Management
K8s allow you to increase the overall utilization of the machines that are in the cluster.
Utilization is defined as the amount of resource actively being used divided by the amount of a resource that has been purchased
Example, if you purchase a one-core machine, and your app uses one tenth of a core, then your utilization is 10%
You can tell k8s the upper limit and lower limit of resources you want for an specific container. Keep in mind that this is on a per-container basis, the whole pod will the sum of the containers.
You can do this by setting up resources in the manifest. The lower limit is
requests and the upper limit is limits.
spec:
    containers:
    - image: blabla:latest
      name: jose
      resouces:
        cpu: "500m"
        memory: "128Mi"
      limit:
        cpu: "1000m"
        memory: "256Mi"
    # more stuff
Persisting Data with Volumes
When a container restarts, any data in it will also be deleted. Which is good since we do not want to leave around cruft.
We can still add volumes to our pods though, that will persist this deletion
In order to do this, you need to two things to the manifest spec.volumes,
which is an array of all volumes that the pod will need.
And the other is volumeMount which specify inside the container definition
the file system to use.
So basically one is like, what volumes will the whole pod use, and the other is specific to each container.
spec:
  containers:
  - name: my-container
    image: busybox:latest
    volumeMounts:
    - name: my-filesystem
      mountPath: /mnt
      subPath: data
  volumes:
  - name: my-filesystem
    persistentVolumeClaim:
      claimName: my-pvc
Labels and Annotations
K8s apps can grow in size and complexity real quick. We can use labels and annotations to help organize our k8s objects/resources as sets of things that map how we think about the app. Making it a bit more human accessible. Meaning we can group resources that make the most sense of the application.
We have two tools that help with this.
- Labels: key/value pairs, to attach identifying information to the k8s obj/resource. You will be able to query based on this.
- Annotations: set non-identifying information that libraries can leverage. These are not meant for querying
Labels
Labels give identifying metadata for k8s objects. They are key/value pairs of strings.
Keys are broken down into two parts
- Optional prefix name, separated by a slash.
- Key name, it must start and end with alphanumeric chars.
Some examples:
acme.com/app-version-1.0.0app.version-1.0.0
Applying Labels
You can do it when doing the k run command. (Doubt that is the way you are
using it but anyway):
k run alpaca-test \
  --image=gcr.io/kuar-demo/kuard-amd64:green \
  --labels="ver=1,app=alpaca,env=test"
You can also add it to the manifest of the resource you are using:
apiVersion: v1
kind: Pod
metadata:
  name: example-pod
  labels:
    ver: "1"
    env: "test"
spec:
  containers:
  - name: nginx
    image: nginx:latest
    ports:
    - containerPort: 80
After the objects have been created, you can do --show-labels
k get deployments --show-labels
Modifying Labels
You can update the labels on objects after creating them:
k label deployemnts alpaca-test "canary=true"
Keep in mind that this will only update the label on the deployment itself, it wont affect any objects created by the deployment.
In case you feel lazy you can replace --show-labels with -L.
k get deployemnts -L canary
To remove a label you add a dash-suffix
k label deployments alpaca-test "canary-"
Label Selectors
Okay so, how do we query this stuff? Using boolean expressions
This will list only the pods that have ver label set to 2.
k get pods --selector="ver=2"
You can get a bit more creative:
This is the AND operator:
k get pods --selector="app=bandicoot,ver=2"
You can kind of do the OR by:
k get pods --selector="app in (alpaca,bandicoot)"
You can also check if a label has been set by just using the key name:
k get deployments --selector="canary"
Check if key is not in value1 or value2:
k get pods --selector="key notin (value1, value2)"
You can combine them
k get pods --selector="ver=2,!canary"
Labels Selector in Manifests
Newer versions support doing something like this:
selector:
  matchLabels:
    app: alpaca
  matchExpressions:
    - {key: ver, operator: In, values: [1, 2]}
Annotations
This are only meant to assist tools and libraries, do not use them for queries.
If you are wondering if something should be a label or an annotations, add information to an object as an annotation and promote it to a label if you find yourself wanting to use it in a selector.
Usually annotations primary use is rolling deployments, they are used to track rollout status and provide the information for a roll back if needed.
Annotations are defined in the metadata part of the manifest:
...
metadata:
  annotations:
    example.com/icon-url: "https://example.com/icon.png"
...
Service Discovery
K8s is a dynamic system. It has to manage placing pods on nodes, make sure they are running and more stuff. Due to this nature k8s makes it easy to run a lot of things, but it can be a bit hard to find these things.
What is Service Discovery?
A service is a method for exposing a network application that is running in one or more Pods in your cluster
Actually you use one type of service discover everyday, DNS, the thing that helps you resolve hostnames to IPs. It works great for the internet, but falls short in the k8s world.
Why? DNS caches a bunch of stuff, and in a k8s cluster pods are ephemeral, they can be killed and come back up in seconds, so due to this cache we could be pointing to something that is already dead.
While these pods that compose the backend may change, the frontend clients should not need to be aware of that, nor should they need to keep track of the of the backend themselves.
K8s has an object/resource specific to this issue.
The Service Object
A Service is an object, it has a manifest and all that. Say you have a set of
pods that each listen on port 5000 and are labeled as name=flask-app. The
manifest would look something like this:
apiVersion: v1
kind: Service
metadata:
  name: my-service
spec:
  selector:
    app.kubernetes.io/name: flask-app
  ports:
    - protocol: TCP
      port: 80
      targetPort: 5000
K8s will assign the service a Cluster IP , and will be continuously scanning
for Pods that match the selector (the flask-app part). Then it will make the
updates to the set of EndpointSlices for the Service.
Using the type NodePorts
By using this type, in addition of a Cluster IP, the system picks a port on every node in the cluster to forward traffic to the service.
Meaning you can connect to any node in the cluster, and reach an specific
service. You can use NodePort without knowing where any of the pods for that
service are running.
apiVersion: v1
kind: Service
metadata:
  name: my-service
spec:
  type: NodePort <--- here
  selector:
    app.kubernetes.io/name: MyApp
  ports:
    - port: 80
      # By default and for convenience, the `targetPort` is set to
      # the same value as the `port` field.
      targetPort: 80
      # Optional field
      # By default and for convenience, the Kubernetes control plane
      # will allocate a port from a range (default: 30000-32767)
      nodePort: 30007
Now each request that is send to the service will be randomly directed to one of the pods that implements the service.
ConfigMaps and Secrets
A good practice is to make your container images reusable, making a general purpose one that can be used across applications. But we might also need to add some configuration to the image at runtime. Here is where ConfigMaps and Secrets come into play.
ConfigMaps
In a ConfigMap you can define env variables, command line arguments or even
small file systems for your containers. The configmap is combined with the Pod
right before it is run.
Creating ConfigMaps
We can create a configmap out of a file. Say for example we have a file
called config.txt:
parameter1 = value1
parameter2 = value2
You can create a configmap by doing:
% k create configmap config --from-file=config.txt
Or you can create literally from the command line
% k create configmap other-config --from-literal=some-param=some-value
Now you can list them
% k get cm
NAME               DATA   AGE
config             1      35s
some-config        1      2s
And get them as yamls
% k get cm config -o yaml
apiVersion: v1
data:
  config.txt: |
    param1 = value1
    param2 = value2
kind: ConfigMap
metadata:
  creationTimestamp: "2024-06-11T00:58:10Z"
  name: config
  namespace: default
  resourceVersion: "2420"
  uid: 7df23db6-7d2c-4db4-9b22-5fecd4bb456e
At the end of the day, the configmaps are just some key/value pairs stores in
an object.
Using a ConfigMap
There are 3 ways of using them:
- File system:
- A ConfigMap can be mounted in a Pod. A file is created for each key, and the content is their respective values
- Command-line Argument:
- Creating command lines dynamically
- Environment Variable:
- It can set the value of an environment variable
Let's see each as an example
- File System Volumes
apiVersion: v1
kind: Pod
metadata
  name: kuard-config
spec:
  containers:
    - name: test-container
      image: gcr.io/kuar-demo/kaurd-amd64:blue
      imagePullPolicy: Always
      command:
        - "/kuard"
    volumeMounts:
    # Mounting the ConfigMap as a set of files
    - name: config-volume # <- HERE
      mountPath: /config
  volumes:
    - name: config-volume # <- HERE
      configMap:
        name: config # <- name of the cm we just created
  restartPolicy: Never
- Command-line Arguments
apiVersion: v1
kind: Pod
metadata
  name: kuard-config
spec:
  containers:
    - name: test-container
      image: gcr.io/kuar-demo/kaurd-amd64:blue
      imagePullPolicy: Always
      command:
        - "/kuard"
        - "$(EXTRA_PARAM)" <- NOTE HERE
      env:
        - name: EXTRA_PARAM
            valueFrom:
            configMapKeyRef
            name: config # <- name of the cm we just created
            key: param1
Note that k8s will perform the correct substitution with a special
$(<env-var-name> )syntax
- Environment Variable:
apiVersion: v1
kind: Pod
metadata
  name: kuard-config
spec:
  containers:
    - name: test-container
      image: gcr.io/kuar-demo/kaurd-amd64:blue
      imagePullPolicy: Always
      command:
        - "/kuard"
      env:
        - name: ENV_PARAM
            valueFrom:
            configMapKeyRef
            name: config # <- name of the cm we just created
            key: param2
Secrets
This are pretty similar to ConfigMaps but they are intended for sensitive information, for example, passwords, tokens, private keys, TLS certs.
This secrets are exposed to Pods via explicit declaration in the Pod manifest and the k8s API.
By default k8s stores secrets in plain text on
etcdstorage. If you have super sensitive information there, and a lot of people with admin access, might be worth encrypting it a bit more.
Creating Secrets
We can create a secret like any other resource
% k create secret generic my-secret --from-file=some.key
Instead of generic -- depending on the secret -- we can use different types
From the manpage
Available Commands:
  docker-registry   Create a secret for use with a Docker registry
  generic           Create a secret from a local file, directory, or literal value
  tls               Create a TLS secret
If we describe it
% k describe secret my-secret
Name:         my-secret
Namespace:    default
Labels:       <none>
Annotations:  <none>

Type:  Opaque

Data
====
some.key:  1984 bytes
The Pods consume the secrets.
Consuming Secrets
We can call the API directly, but more often we will access secrets from a
Secrets Volume. These volumes are created at pod creation time, and are
stored in tmpfs (meaning memory not disk).
Each secret is in a different file under the target mount point. So if we mount
the my-secret secret in the /keys directory, it would looks something like
/keys/some.key.
The Pod manifest would end up looking something like this:
apiVersion: v1
kind: Pod
metadata
  name: kuard-secret
spec:
  containers:
    - name: test-container
      image: gcr.io/kuar-demo/kaurd-amd64:blue
      imagePullPolicy: Always
    volumeMounts:
    - name: keys
      mountPath: /keys
      readOnly: true
  volumes:
    - name: keys
      secret:
        secretName: my-secret # <- name of the secret we just created
Private Container Registries
You can also create a secret for for use with a Docker registry. Instead of
generic you would use docker-registry, with --docker-username,
--docker-password and --docker-email and the manifest would look something
like this:
apiVersion: v1
kind: Pod
metadata
  name: kuard-secret
spec:
  containers:
    - name: test-container
      image: gcr.io/kuar-demo/kaurd-amd64:blue
      imagePullPolicy: Always
    volumeMounts:
    - name: keys
      mountPath: /keys
      readOnly: true
  imagePullSecrets:
  - name: my-image-pull-secrets-from-registry # <- name of that secret
  volumes:
    - name: keys
      secret:
        secretName: my-secret
Naming Constrains
Key names need to be valid variable names. Just use normal names and you will be fine.
-
valid
.tokensecret.tokenconfig_file
-
not valid
token..keyauth token.key_token
Just not use spaces, double dots and stuff like that.
Managing ConfigMaps and Secrets
The usual stuff, get, delete, create. Just a note on creating:
--from-file=<filename>: keys in file will be keys in secret--from-file=<key>=<filename>: keys in file will be keys in secret- Instead of:
You would getData ==== <filename>: ---- param1 = value1 param2 = value2Data ==== <key>: ---- param1 = value1 param2 = value2
- Instead of:
--from-file=<directory>: loads all files in a directory
Also you can recreate and update like:
kubectl create secret generic kuard-tls \
  --from-file=kuard.crt --from-file=kuard.key \
  --dry-run -o yaml | kubectl replace -f -
Neat trick from the book Kubernetes Up and Running by Brendan Burns, Joe Beda, and Kelsey Hightower O'Reilly.
📝 k8s cheatsheet
Some useful commands
using kind?
in you mac? with podman?
podman machine init
podman machine start;
export KIND_EXPERIMENTAL_PROVIDER=podman;
kind create cluster
Describe Cluster
-
Check version
% k version # what do you think it does? :) *Client Version: v1.28.3 Kustomize Version: v5.0.4-0.20230601165947-6ce0bf390ce3 Server Version: v1.29.2* -
Check cluster status
% k get componentstatuses # will be deprectated
Warning: v1 ComponentStatus is deprecated in v1.19+
NAME                 STATUS    MESSAGE   ERROR
controller-manager   Healthy   ok
scheduler            Healthy   ok
etcd-0               Healthy   ok
or talk directly to the endpoint
% k get --raw='/readyz?verbose' [+]ping ok [+]log ok [+]etcd ok [+]etcd-readiness ok [+]informer-sync ok # more messages readyz check passed -
List k8s nodes
% k get nodes
NAME                 STATUS     ROLES           AGE   VERSION
kind-control-plane   Ready   control-plane   13s   v1.29.2
node01               Ready   <none>          13s   v1.29.2
In k8s nodes are separated into
control-panelnodes, like the API server, scheduler, etc. which manage the cluster, andworkernodes where your containers will run. -
Get more information about a specific node (prints bunch of info)
% k describe nodes kind-control-planemore info on the ouput here
-
See the proxies if they are under the API object named DaemonSet
% k get daemonSets --namespace=kube-system kube-proxy -
See DNS k8s deployment
% k get deployments --namespace=kube-system coredns -
Wait for nodes to be ready
% k wait --for=condition=Ready nodes --all
node/node1 condition met
node/node2 condition met
...
Manage your context
-
Change namespace for current context
% kubectl config set-context --current --namespace=<some ns>
⎈ helm
⚠️ These are notes taken from the book Learning Helm by Matt Butcher, Matt Farina and Josh Dolitsky on O'Reilly Please go read it and just use this as reference.
Introduction
Helm is the package manager for k8s. Let us do a super quick dive into what k8s is an all that just to give the context necessary to understand helm.
Context for Helm (containers & k8s)
Sometime ago someone thought of a new way of making apps, instead of them being a big monolithic service, we could split everything into small discrete standalone services. Then we could join those services using API over the network and build the application that way. That is how microservices were born.
Containers
To help with this the concept of containers was introduced, it is different of a VM because the VM runs an entire OS on on a host machine. On the other hand, a container has its own file system, but it uses the same OS kernel as the host.
A container is a program together with its dependencies and environment, they are packaged together into a container image which can be build based on a file where you specify the packages you want to run, and how to set the environments. The cool part is that all those instructions are not compiled into a binary or anything, but they are packaged into discrete layers.
So if a host has an image with five layers, and there is another host that needs the same image, it will just fetch the layers it does not already have.
Say you have three images using fedora-minimal:37, well it would reuse that
layer on all those three.
Those images are stored in a registry, the registry tells hosts which layers compose an image. So the host can only download the layers it need from the registry.
A registry identifies an image by three things:
- name: basically a string
fedoraorfedora-minimal - tag: usually the version
latestorv1 - digest: a hash of the image, since the tags are mutable.
They look like name:tag@digest.
Kubernetes (or k8s like the cool kids call it)
So with all these container stuff, some questions begin to arise:
- How do we best execute lots of containers?
- How can they work together?
- How do we manage memory, cpu, network and storage?
Well a bunch of companies tried to create this orchestration of containers technology to answer those questions, at the end as per 2024 seems like Google won, and we now all use ⛵️ K8s.(which is greek for ship's capitan or something like that)
K8s won because it introduced two concepts that people really liked.
-
Declarative infrastructure Basically you tell k8s what your desired state of the cluster is, and it will work to make that happen.
-
Reconciliation loop How does k8s work behinds the scenes to reach the declarative configuration we set? Using a reconciliation loop.
In a reconciliation loop, the scheduler says: "Here is what the user wrote as his/her desired state. Here is the current state. They are not the same, lets reconcile them."
Say you specified storage, and the scheduler sees that we do not have storage yet, it will create units of storage and attach them to your containers.
Pods
We do not deal directly with containers when setting up our k8s cluster.
We use a pods. A pod which is basically a group of containers. These are
defined in a manifest (yaml or json, but most people use yaml)
apiVersion: v1 # we can see that this will be a v1 Pod
kind: Pod
metadata:
    name: example-pod
spec:
    containers:
    - image: "fedora-minimal:latest"
    - name: example-fedora
A Pod can have 1 or more containers. The containers that help preconfigurate stuff for the main one, are called init containers.
The ones that run alongside the main container are called sidecar containers
ConfigMaps
Basically in a pod you describe the configuration the containers need, like
network ports files system mount points. You can store configuration
information for k8s in ConfigMaps and password and stuff like that in
Secret.
Here is an example:
apiVersion: v1
kind: ConfigMap
metadata:
    name: configuration-data
data: # inside here we will declare aribitrary key/value stuff
    backgroundColor: blue
    title: Learning Helm
For Secret is pretty much the same as for ConfigMaps but the values in data
must be Base64 encoded.
Pods then can be linked to the ConfigMaps like this:
apiVersion: v1
kind: Pod
metadata:
    name: example-pod
spec:
    volumes:
    # note that this is not the metadata name you used in the ConfigMap
    - name: my-configuration
      configMap:
        name: configuration-data # same name as in metadata of ConfigMap
    containers:
    - image: "fedora-minimal:latest"
      name: example-fedora
      env:
        - name: TITLE # the env variable will be title
          valueFrom:
            configMapKeyRef:
                name: configuration-data # name for the volume
                key: title # key in the actual ConfigMap
Deployments
Pretty cool stuff, but we might not just one to run one instance of our
container, therefore we can use something called Deployments.
A Deployment describe an application as a collection of identical pods,we can
tell k8s to create our app with a single pod and scale it up to five pods.
apiVersion: apps/v1 # apps/v1 Deployment
kind: Deployment
metadata:
    name: example-deployment
    labels:
        app: my-deployment
spec:
    replicas: 3 # we want three replicas of the following template
    selector:
        matchLabels:
            app: my-deployment
    template:
        metadata:
            labels:
                app: my-deployment
        spec:
           containers :
            -image: "fedora-minimal"
             name: "example-fedora"
Service
A Service is a persistent network resource, that persists even if the pod or
pods attached to it go away.
apiVersion: v1
kind: Service
metadata:
    name: example-service
spec:
    selector:
      app: my-deployment
    ports:
      -  protocol: TCP
         port: 80
         targetPort: 8080
Here we define a service for the pods with the app: my-deployment, telling
that traffic port 80 of this Service will be routed to 8080.
Helm's Goal
So we have seen the building block of K8s, say you want to deploy a WordPress
app, you would need a Deployment for the containers, then a ConfigMap and
Secret for the password, maybe some Service objects and so on. That sounds
like a lot of yaml.
The core idea of Helm is that all those objects can be packaged to be
installed, updated and deleted together.
Basically helm is the package manger of kuberentes. Helm will allow you to spin up all the k8s objects necessary for an app by just using a few commands.
Here are some of the things that helm can do:
- Provide package repos (similar to
dnforapt). - Familiar install, upgrade, delete commands.
- Helm has a method for configuring the packages before installing them.
- Helm can also let you know what already is installed.
You can also limit the installation of packages to a specific namespace, so you can install the same package in different namespaces in the same k8s cluster. (What is a namespace?)
Helm also provides reusability, it uses charts for this. A chart provides a pattern for producing the same k8s manifests. But the cool part is that you can also add more configuration to those charts.
Helm provides patterns for storing the initial configuration plus the changes
you did. Helm encourages k8s users to package their yaml into charts so that
these descriptors can be reused.
One last thing, keep in mind that helm is not a configuration tool, it helps but it there are software specialized on that like ansible, puppet or chef.
Helm Architecture
Here are the main components that helm uses.
K8s Resource/Object
These are the Pods, ConfigMap, Deployment, we have seen throughout the
chapter. K8s has a lot of these objects, you can even define custom ones using
custom resource definition (CRD).
All the resources share some elements
apiVersion: apps/v1 # api and version of the resource
kind: Deployment # resource type
metadata: # top-level data on the resource/object
    name: example-deployment # req for all objects
    labels: # used for creating query-able handles
        some-name: some-value
    annotations: # authors to attach their own keys and values
        some-name: some-value
Charts
A package is called a chart. The idea es that k8s meaning captian, helm being the steering mechanism of the ship. The chart plots the way k8s apps should be installed.
A Chart is a set of files and directories that describe how to install the different k8s resource/objects
A chart contains
Chart.yaml: describes the chart (name, description, authors)templatesdirectory: Inside all the k8s manifests potentially annotated with templating directivesvalues.yamlfile that provides the default configuration. You can override during installation.
These are the basic stuff for an unpacked chart, a packed chart is just a tar ball with all this inside.
Resources, Installations and Releases
When a helm chart is installed:
- helm reads the charts (will download if necessary)
- It sends the values into the templates generating the k8s manifests
- The manifests are sent to k8s
- K8s creates the requested resources inside the cluster
One last concept release. A release is created each time we use helm to modify the installation
Using Helm
Helm is a cli, you can install it with your favorite package manger or build it from source it is written in golang.
You can check the version by
helm version
Helm will use the same KUBECONFIG file you have configured for kubectl, it
will look in the same places, though you can specify a path for one.
The most common workflow is:
- Add a chart repo
- Find a chart to install
- Install a Helm chart
- See the list of what is installed
- Upgrade your installation
- Delete your installation
Adding a Chart Repo
A Helm Chart is an individual package that can be installed into your k8s cluster. You can find then at chart repositories.
You can find popular repositories in the artifact hub
By default helm does not have any repo added, so you need to look for one
there.
Bitnamis's official Helm charts are one of the best well-curated charts repos. (Some Bitnami devs are among the core contributors who design the helm repo system)
To add a repo you do helm repo add so:
% helm repo add bitnami https://charts.bitnami.com/bitnami
"bitnami" has been added to your repositories
Now if you do
% helm repo list
NAME    URL
bitnami https://charts.bitnami.com/bitnami
You will see it there. After that we can look for specific charts.
% helm search repo drupal
NAME            CHART VERSION   APP VERSION     DESCRIPTION
bitnami/drupal  18.0.2          10.2.5          Drupal is one of the most versatile open source...
You can also search label and descriptions
% helm search repo content
NAME                    CHART VERSION   APP VERSION     DESCRIPTION
bitnami/drupal          18.0.2          10.2.5          Drupal is one of the most versatile open source...
bitnami/harbor          21.1.2          2.10.2          Harbor is an open source trusted cloud-native r...
bitnami/nginx           16.0.6          1.25.5          NGINX Open Source is a web server that can be a...
bitnami/owncloud        12.2.11         10.11.0         DEPRECATED ownCloud is an open source content c...
bitnami/wordpress       22.2.2          6.5.2           WordPress is the world's most popular blogging ...
The chart version is the version of well, the chart. On the other hand the app version is the version of the software it would install.
Installing a package
% helm install mysite bitnami/drupal
NAME: mysite
LAST DEPLOYED: Wed May  1 16:40:16 2024
NAMESPACE: default
STATUS: deployed
REVISION: 1
TEST SUITE: None
NOTES:
# more text
Typical stuff, just a few things to keep in mind.
-
Difference between an installation and a chart.
An installation of a chart is a specific instance of the chart One chart may have many installations
-
You can repeat instance names (
mysite), but it must be on different namespaces.
You can set values specific to your installation, you can set them directly
from the command line with --set for example. (this works with both set
install and upgrade)
% helm install mysite bitnami/drupal --set drupalUsername=admin
You can also have them in a yaml file, which is the recommended approach.
% helm upgrade mysite bitnami/drupal --values values.yaml
For example values.yaml would look like this:
drupalUsername: admin
drupalEmail: [email protected]
mariadb:
    db:
        name: "my-database"
Listing your Installations
% helm list
NAME    NAMESPACE       REVISION        UPDATED                                 STATUS          CHART           APP VERSION
mysite  default         1               2024-05-01 16:40:16.50636 -0600 CST     deployed        drupal-18.0.2   10.2.5
Not much to say here, does what expected.
Upgrading an Installation
So there are two types of changes:
- upgrade version of the chart
- upgrade configuration of the chart
Every time we perform an upgrade we are doing a new release of the same installation.
Helm will attempt to to alter only the bare minimum, so if you only changes one simple configuration variable, it will not like restart everything and all that.
To restart stuff just use kubectl.
To update your chart with a new version you can
% helm repo update
% helm upgrade mysite bitnami/drupal
Configuration Values
If you do this:
% helm install mysite bitnami/drupal --values values.yaml
% helm upgrade mysite bitnami/drupal
Chances are you lost your values, so it is good to always send the yaml
% helm install mysite bitnami/drupal --values values.yaml
% helm upgrade mysite bitnami/drupal --values values.yaml
You can use helm get values mysite to see the values sent on the last install
or upgrade.
You could also use:
% helm upgrade mysite bitnami/drupal --reuse-values
But it is not recommended
Uninstalling charts
Not much to say here
% helm uninstall mysite
Works as you would expect, if you would do
% helm list
You will not see it there.
Lastly, you can see a special record that contain release information.
% k get secret
Helm stores there the info.
If you uninstall you loose the history, so be careful. You could helm uninstall --keep-history. Good if you plan on doing helm rollback.
That is pretty much the basics on helm.
What is Fluentd
It is a event/data collection tool. We can have multiple applications with tons of different logs formats. Fluentd tries to unify them.
It is extensible, the core program is small, and does only the main stuff.
- Divide & Conquer
- Buffering & Retries
- Error Handling
- Message Routing
- Parallelism
It delegate the rest to the users via plugins, reading data, parsing data, buffering data, write data.
It is reliable, it is important to not loose data. Fluentd tries to move the data in small pieces and checks if the data passed successfully if not it retries.
Fluentd can tag the data and route it according to the label.
Use Cases
Simple Forwarding
You have some simple files that and logs from a port and want to forward them to mongodb. Here is a simple configuration example.
logs from a file
<source>
    type tail
    path /var/log/httpd.log
    format apache2
    tag web.access
</source>
logs from client libraries
<source>
    type forward
    port 24224
</source>
store logs to ES and HDFS
<source backend.* >
    type mongo
    database fluent
    collection test
</source>
Lambda Architecture
📈 Elastic Stack (ELK)
Table of contents
ELK is great for Centralized Logging, this enable us to not waste time trying to find where the issues are, we have all in one place. We also can
Kibana is the visualization of the ELK stack, you can visualize the data on real time.
Components
It has several open source add-ons, but the main ones are these:
- Beats:
- Light weight way of getting data into the ELK stack.
- Single purpose tools.
- Logstash:
- Transform data as it comes into structured data that will be stored.
- Very resource intensive
- Example: is like cutting carrots 🥕 as you get from the store and saving them to the fridge, instead of cutting them until you are about to cook
- Elasticsearch:
- The part of the stack that stores the data itself
- Usually deployed by a cluster, it has redundant copies so it can work if something fails
- Kibana:
- Web front end for the ELK stack
- Quick bird’s eye view across your infra
Logstash
Three block of code in config
- Input: get data in
- Output put data somewhere, usually elasticsearch
- Filter block: where data is transformed and relocated, where we can parse lines.
Example of config file.
input { stdin {} }

filter {
	mutate {
		add_field => { "greeting" => "Hello %{message}" }
	}
}

output { stdout {} }
This will take input from STDIN and output it to STDOUT, anything we type would be returned in a structured format with a greeting field.
Logstash Plugins
It has more than 100 packages installed with logstash
/usr/share/logstash/bin/logstash-plugins list for listing them
-
Beats: Input plugin to work with
beatsinput { beats { port => 5044 } } -
File:
- Get input from a file, or multiple, you can use wildcards
input { file { path=> "/var/log/kern.log" } } -
elasticsearch
- this is an output plugin, you can point to multiple servers
output { elasticsearch { host => ["localhost:9200"] } }
Filters
-
Grok
- convert unstructured data to structured data
- based on regex, but it has many abstractions in case you want to use them
filter { grok { match => { "message" => "%{IP:client} %{WORD:method} %{URIPATHPARAM}:request...." } } } -
Mutate
- let you transform the data
filter {
	grok {
		match => {
			"message" => "%{TIMESTAMP:t} new users: %{GREEDYDATA:users}"
			# 2024-01-23 new users: jose,pedro,maria
		}
	}

	mutate {
		split => {"users" => ","}
	}
}
In this example grok will get the time stamp of the message and will get all the string after
new users:then we use mutate to split the users and have it stored as a list so when the data shows up in elasticsearch it looks like an array
GrokConstructor
grokconstructor.appspot.com Helper for creating grok filters.
You can see also some grok patterns too.
Basically you can paste the logs there build your filter from there
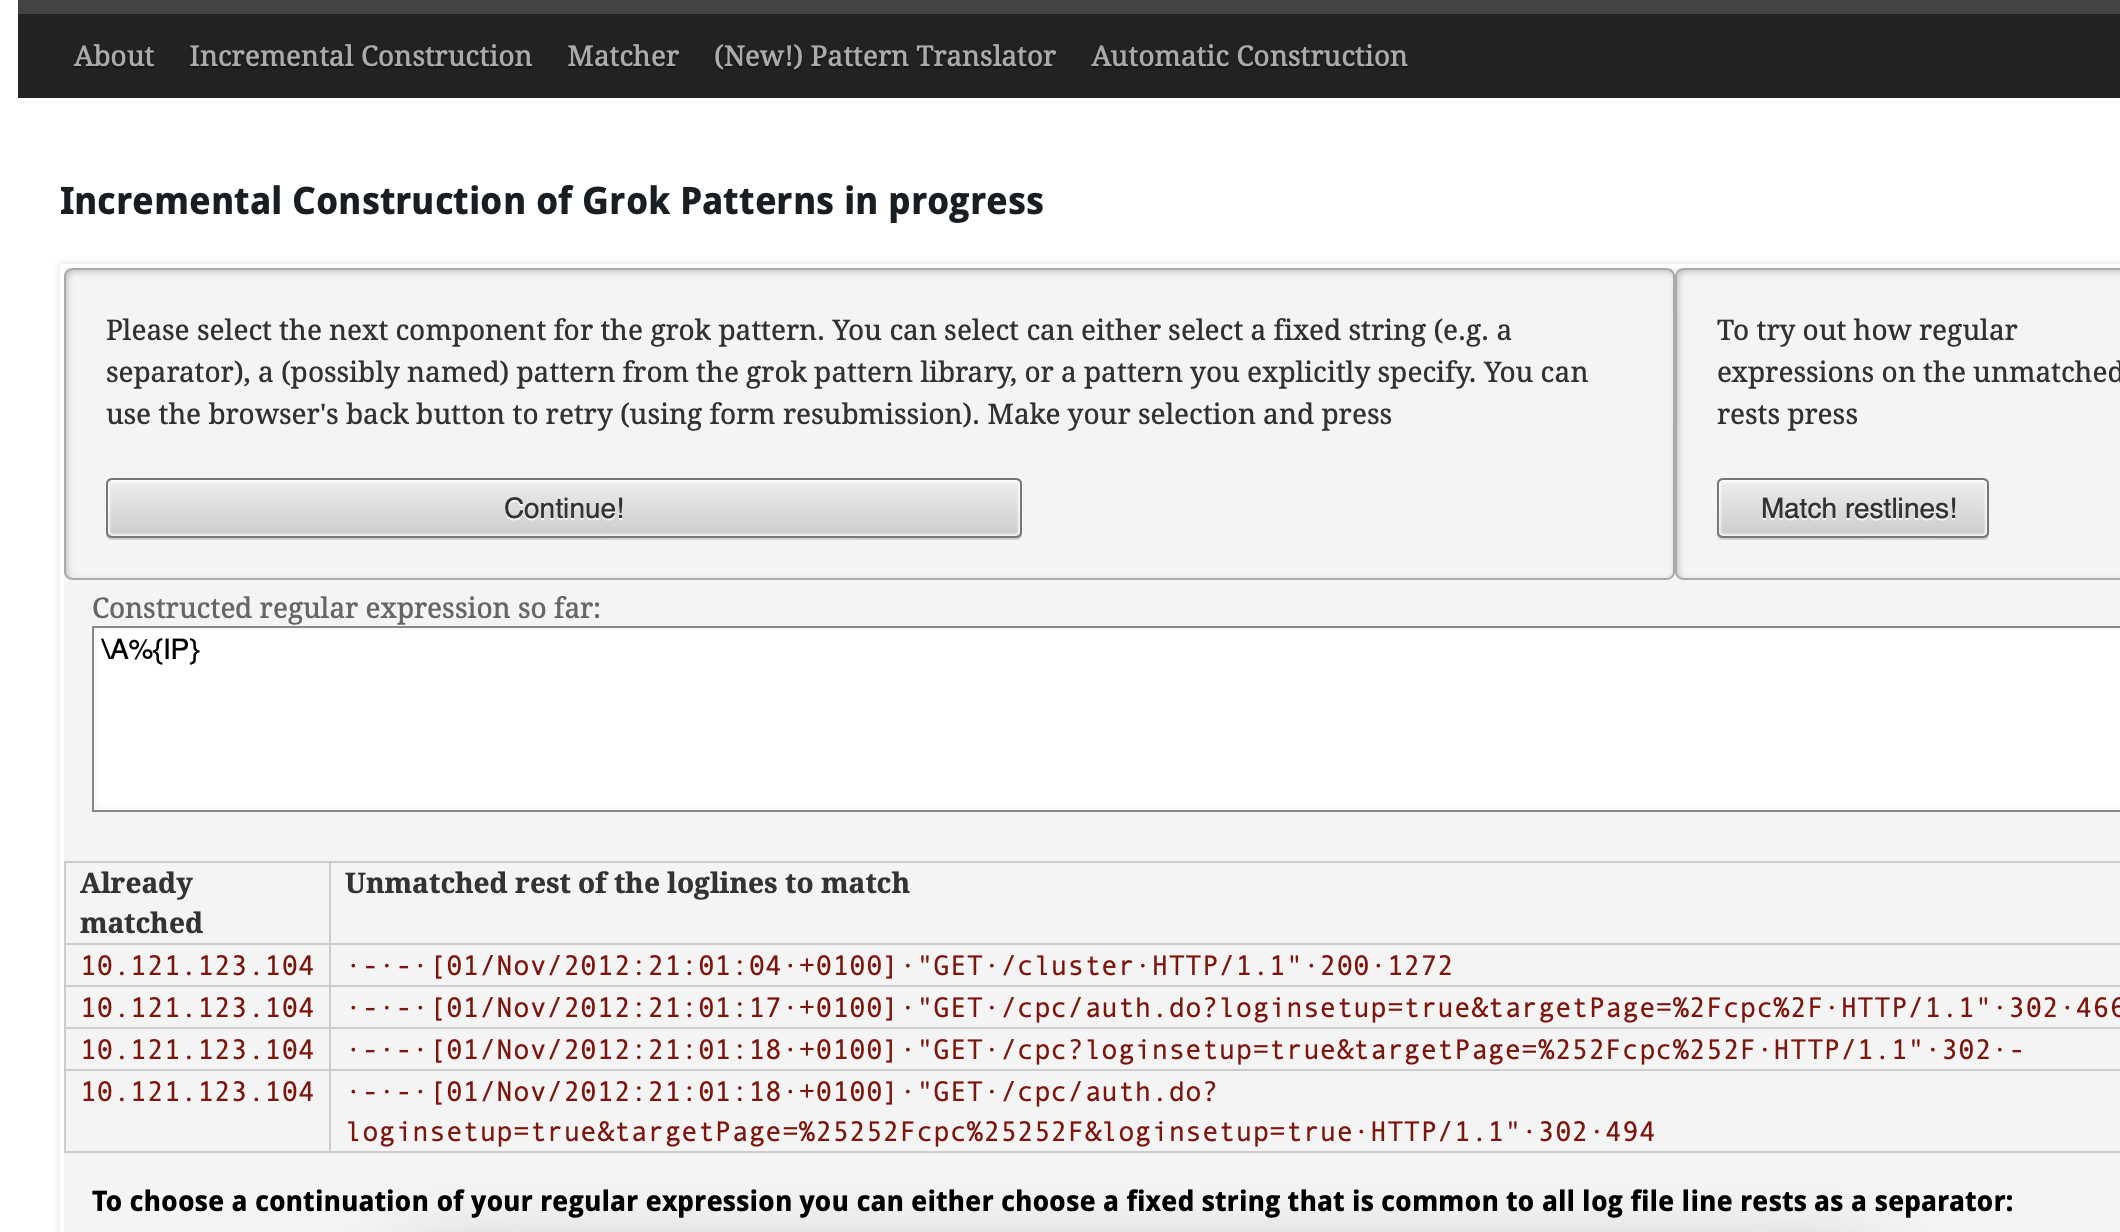
Beats
Why use beats? Logstash is overkill for a lot of things people use it for.
It uses JRuby (basically ruby that runs on the JVM), and by default it is configured to set aside 1GiB of memory for the JVM. That is too much to just send things to Elastic
Beats (written in Go) is way more 🪽lightweight, it has been design to be. Becuase of this can be run everywhere.
There are several beats
- Heartbeat (Uptime)
- Filebeat (Logs and text data)
- Metricbeat (Metrics)
- Packetbeat (Network data)
- Winlogbeat (Windows events logs)
- Auditbeat (audit logs and data)
- Functionbeat (serverless data)